Download
1 / 19
220 likes | 487 Views
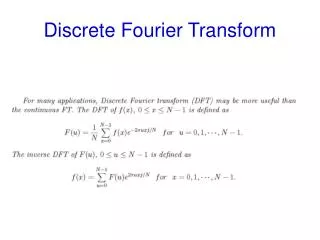
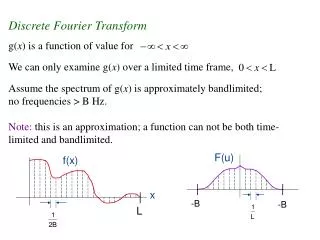
Discrete Fourier Transform and Applied Spectral Analysis. Discrete Fourier transform. Let - periodicity interval of continuous function -the lowest frequency , then: ,where m - integer number. Fourier series: (1)

E N D
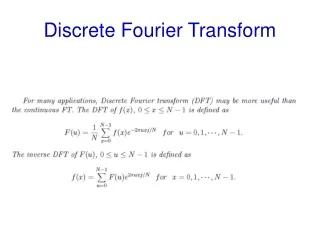
Discrete Fourier transform Let - periodicity interval of continuous function -the lowest frequency , then: ,where m - integer number. Fourier series: (1) Coefficients: (2) Continuous Fourier transform: Direct: (3) (4) Inverse:
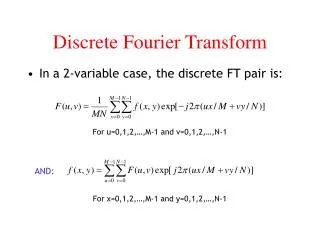
The lowest frequency and increment of the angular frequency Direct Discrete Fourier transform (DFT): Current frequency “k” is the time domain index, “n” is the frequency domain index Relative frequency: Inverse Discrete Fourier transform (IDFT):
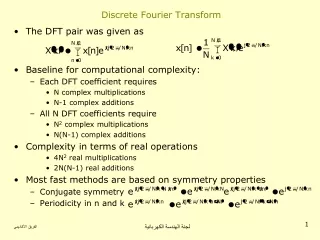
(10) Direct DFT: Inverse DFT : Properties of DFT: 1) symmetry property 2) skew-symmetry of the algorithm (11) (12)
Computation of DFT and IDFT. When k=N, Presentation of DFT in the form of IDFT: (16)
Matrix of the DFT. (17)
FFT and IFFTAlgorithms If (1) Then (2) or (3) z(k) and y(k) are samples of the process in the time domain.
Then (1) can be rewritten as: (4) or N dimension In order to save memory cells, it is possible to save Y(n) and Z(n) in the same register: (5) 1 array of N dimension is transformed in (3) where (6)
1 1 - - - - Taking into account: We receive: (7) “Butterfly” graph (algorithm)
1 + - Example: transformation of two 4-points DFT in one 8-points DFT Example: Transformation of 2- and 4-pointed ДПФ in the 8-pointed one
Transition from N/4-points to N/2-points DFT: Small Turn Factor
Transition from 2-points to 4-points DFT: Adjacency matrix
Power Spectral Density estimation Power or variance: Power Spectral Density:
Periodogram: Convolution in the Frequency Domain: -time domain: -frequency domain:
x(t) 2 1 t T -T Gibbs Phenomenon <sinc>=<sinus cardinalis> |X (T)| =|sinc(T)| X(T)=sinc(T)
Parseval's theorem: Estimations of cross spectra The square of coherence coefficient:
Error variances Stochastic process generation. Rice-Pearson decomposition.