Download
1 / 30
300 likes | 439 Views
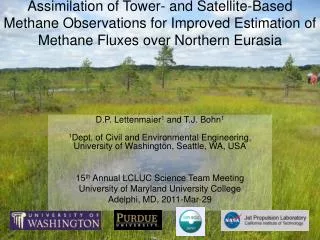
Assimilation of Tower- and Satellite-Based Methane Observations for Improved Estimation of Methane Fluxes over Northern Eurasia. D.P. Lettenmaier 1 and T.J. Bohn 1 1 Dept. of Civil and Environmental Engineering, University of Washington, Seattle, WA, USA

E N D
Assimilation of Tower- and Satellite-Based Methane Observations for Improved Estimation of Methane Fluxes over Northern Eurasia D.P. Lettenmaier1 and T.J. Bohn1 1Dept. of Civil and Environmental Engineering, University of Washington, Seattle, WA, USA 15th Annual LCLUC Science Team Meeting University of Maryland University College Adelphi, MD, 2011-Mar-29
West Siberian Lowlands Importance of Lakes and Wetlands • Lakes: • Large CO2/CH4 source • CH4 estimates revising upwards due to ebullition • Wetlands: • Largest natural global source of CH4 • Large C sink • Northern Eurasia contains: • 30% of world’s wetlands (Gorham, 1991) • Large portion of world’s lakes Lehner and Doll, 2004 Lake/wetland carbon emissions are sensitive to climate High latitudes experiencing pronounced climate change
Climate Factors Temperature (via metabolic rates) CO2 CH4 CO2 Relationships non-linear Water table depth not uniform across landscape - heterogeneous NPP Living Biomass Acrotelm Temperature (via evaporation) Aerobic Rh Water Table Precipitation Anaerobic Rh Catotelm Note: currently not considering export of DOC from soils
Lakes and Wetlands • Lake/wetland CH4/CO2 emissions depend on T, C, nutrients, oxidation state, etc • Wetland CH4/CO2 fluxes also depend on soil moisture CH4 Seasonally Inundated Soil (flooded) Permanent Lakes Unsaturated Soil Saturated Soil Water Table • Areal extent of wet zones can vary substantially in time • Temporal variations in area play important role in response of CH4/CO2 fluxes to climate • We can improve model estimates by taking dynamic behavior into account
Monitoring the Sources • In situ measurements (water table, CH4 flux) are localized and sparse • Large-scale observations (towers, satellites) are less direct • Extent of saturated/inundated wetlands (e.g. SAR, passive microwave) • Atmospheric CH4 concentrations (e.g. towers, GOSAT) • Large-scale runoff (stream gauges) • Large-scale biogeochemical models can bridge the gap between indirect observations and the processes we want to monitor • Sub-surface soil moisture, temperature, methanogenesis • Simultaneous large-scale observations of multiple variables can constrain model parameters
Science Questions How do wetland methane emissions in W. Siberia respond to environmental conditions over a range of temporal and spatial scales? • Can wetland methane emissions in western Siberia be effectively monitored by a combination of models, towers, and remote sensing observations? • Can tower and/or satellite observations be used to constrain errors in or identify areas for improvements in the models (e.g. poor representations of physical processes, state uncertainties, parameter uncertainties)? • How much do SAR-based surface water products improve the match between simulated and observed methane concentrations? • Can integration of satellite-based and tower-based (near-surface) atmospheric methane concentrations via data assimilation methods lead to better understanding of the space-time distribution of methane emissions over northern Eurasia?
Collaborators • Dennis Lettenmaier (PI) and Ted Bohn, University of Washington • Kyle McDonald (co-PI), Erika Podest, and Ronny Schroeder, JPL/NASA • Shamil Maksyutov, Motoki Sasakawa, Heon-Sook Kim and Toshinobu Machida, National Institute for Environmental Studies (NIES), Japan • Mikhail Glagolev, Moscow State University, Russia
Modeling Framework • VIC hydrology model • Large, “flat” grid cells (e.g. 100x100 km) • On hourly time step, simulate: • Soil T profile • Water table depth ZWT • NPP • Soil Respiration • Other hydrologic variables… • Link to CH4 emissions model (Walter & Heimann 2000)
Cumulative Area Drier Wetter “Dry” “Wet” Recent Progress in Modeling 3 Main approaches to modeling large-scale CH4 emissions: • 1. “Distributed” scheme: • Heterogeneous water table and CH4 • Used by UW Saturated / Inundated Water Table Position Depth Soil Surface • 2. “Uniform” scheme: • Water table and CH4 emissions vary in time but uniform across grid cell • Oversensitive to climate • Biased +/- 30% Water Table CH4 Emissions • 3. “Wet-Dry” scheme: • Simulates time-varying saturated area • Ignores water table and emissions from unsaturated zone • Biased up to 30% too low (Bohn and Lettenmaier, GRL, 2010)
DEM (e.g. GTOPO30 or SRTM) Topographic Wetness Index к(x,y) Topographic Wetness Index CDF кmax кi кmin Water Table Depth Zwt(t,x,y) Soil Storage Capacity CDF(mm) = f(кi) Smax Cumulative Area Fraction 0 1 Saturated At Surface Water Table 0 Cumulative Area Fraction 0 1 Distributed Water Table Summarize for a Single 100 km Grid Cell 1 km Resolution VIC Spatial Avg Soil Moisture (t)
Comparison with PALSAR • Spatial distribution of inundation compares favorably with remote sensing • This offers a method to calibrate model soil parameters Simulated Inundated Fraction (at optimal Zwt) Simulated Inundated Fraction (at optimal Zwt) Observed Inundated Fraction (PALSAR Classification) Observed Inundated Fraction (PALSAR Classification) ROI 3 2006-05-28 ROI 1 2006-06-09 ROI 2 2007-07-06 ROI 4 2007-07-18 Approx. 30 km
VIC Dynamic Lake/Wetland Model • Water & energy balance model • Includes mixing, ice cover • Dynamic area based on bathymetry • Can flood surrounding wetlands based on topography Special application: treat all lakes, ponds, and inundated wetland area as a single “lake” Bowling and Lettenmaier, 2010
Composite Bathymetry • How much area is covered by water of depth >= a given threshold? • Sum the areas of all lakes having depth > threshold • Given a volume of surface water, we know how much area it will cover + + + = Depth Cumulative area
Lake Bathymetry/Topography Lake size histograms from GLWD (Lehner and Doll, 2004) and LANDSAT Lake depths from literature • ILEC • Arctic Thaw Lakes • Bog Pools • LANDSAT • GLWD • Bartalev et al (2003) Lake storage-area relationship LANDSAT courtesy of E. Podest and N. Pinto of NASA/JPL SRTM and ASTER DEMs for surrounding topography
First Phase: Historical Reconstruction • Select test basins in West Siberian Lowlands • Simultaneous calibration to both streamflow and inundated area • Streamflow gauge records from R-Arcticnet (UNH) • Inundated area derived from AMSR/QSCAT (NASA/JPL) • Hydrologic calibration parameters • Soil layer thickness • Infiltration distribution • Maximum baseflow rate • Effective lake outlet width • Parameters – CH4 • Calibrated against observations at Bakchar Bog (Friborg et al, 2003) • For lakes, use range of observed CH4 rates from literature: • 10-50 mg CH4/m2d (Repo et al, 2007) • 100-500 mg CH4/m2d (Walter Anthony et al, 2010) • Ultimate goal: estimate of responses of lakes and wetlands across West Siberia to end-of-century climate • For now: what are the sizes and seasonal behaviors of the various CH4 sources?
Close correspondence between: • wetness index distribution and • observed inundation of wetlands from satellite observations Study Domain: W. Siberia Wetness Index from SRTM and ASTER DEMs Ural Mtns WSL Peatland Map (Sheng et al., 2004) Ob’ R. Permafrost Syum TWI 16 (wet) Konda Dem’yanka 8 (dry) Vasyugan Chaya
Comparison With Observed Discharge Monthly Avg Annual Flow Syum Modeled snowmelt pulse is narrower than observed Vasyugan Konda Interannual variability is good (where record is long enough) Dem’yanka
AMSR/QSCAT-Derived Inundation Annual Max – Min Fractional Inundation • Daily, for snow-free days • 2002-2009 • 25km resolution Max % - Min % > 15 % < 3% Courtesy R. Schroeder, NASA/JPL
Comparison With Observed Inundation Syum Seasonal inundation can more than double lake area Vasyugan Canonical lake area Konda Poor match because AMSR/QSCAT is lower than canonical lake area Dem’yanka Large saturated area
Monthly Averages, 1948-2007, Syum Basin 1. Areas Total Wetland = 18% Unsaturated wetland is the largest contributor to CH4 in summer because of its large area Lake + Inund + Saturated = 3 - 6% Lake + Inund = 1 - 3% Lake = 0.6% 2. CH4 1. Lake emits at same rate as saturated wetland 2. Lake emits at rate of 50 mg CH4/m2d 3. Lake emits at rate of 500 mg CH4/m2d CH4 (mg/m2mo) CH4 (mg/m2mo) CH4 (mg/m2mo) (=30 mg/m2d) (Fluxes per unit area of entire basin)
Annual Averages - Syum • Lakes have highest emission rate per unit area • If we assume high lake CH4 emission rates (100-500 mg/m2d) constant throughout year, lakes reach 9-32% of basin emissions • But total lake contribution small • Saturated wetland is largest component • Unsaturated wetland is second largest, due to its large area • Relative contributions of saturated and unsaturated zones vary in time with soil moisture • This depends on wetland CH4 parameter set, and assumption that it applies everywhere in the wetland
Current Status • Refining the CH4 model parameters with extensive in situ chamber flux observations from M. Glagolev (Moscow State U) and S. Maksyutov (NIES) • Simulation of methane fluxes from W. Siberia, 1948-2007, currently under way
Data Assimilation • Link VIC model to NIES atmospheric transport model (NIES-TM) • State variables • Soil moisture • Surface inundation (linked to soil moisture) • Atmospheric CH4 concentration • Observations • AMSR/QSCAT inundation • Tower [CH4] (initially) • Possible addition of GOSAT Total Column [CH4]
State Variables and Observations (observed by towers and satellite) Surface Water CH4 (observed by satellite) As Soil Surface Depth ? ? ? Water Table (poorly constrained) Water table position related to total soil moisture Drier Wetter Cumulative Area
NIES Tower Network • 60-100m towers • Hourly measurements of CH4, CO2 • 2 sampling heights at each tower: 10-40m, 40-80m (Courtesy M. Sasakawa, NIES)
JAXA GOSAT • Launched 2009 • Total column CH4 and CO2 • 10 km spatial resolution • 1000 km swath width • 3 days/44 orbit repeat cycle CH4, June-August 2010
NIES Atmospheric Transport Model (NIES-TM) • Tracer transport/diffusion model • Driven by NCEP/NCAR fields • 2.5 x 2.5 degree resolution (resolution of drivers) • 15 Vertical layers (1000 mbar, 850, … up to 10 mbar) • 15 min temporal resolution • West Siberian simulation nested within global simulation • CH4 sources for the rest of the world taken from Matthews and Fung (1987), Patra et al (2009) • Tracks several species and reactions relevant to CH4 transport and oxidation, OH by Sudo et al (2002) • Used successfully in inverse modeling of global CO2 sources in TRANSCOM experiment (Law et al., 2003)
Data Assimilation: Updates • Daily (AMSR/QSCAT only) or Weekly • Ensembles formed from perturbed initial soil moisture states • (or multiple NCEP/NCAR realizations, a la ESP) • Ensemble Kalman Filter • Update state variables in place, i.e. at same time/location as observation • Can’t use atm CH4 to update soil moisture due to time lag between source and observation • Ensemble Kalman Smoother (van Leeuwen and Evensen, 1996) • Takes account of all observations and model states at all times between updates • Can update state variables backwards in time, along particle trajectories between sources and observations
Conclusions • Lakes have large per-area emissions but in many cases small total area • The saturated and unsaturated areas of the wetland are large contributors of CH4 as a result of their large extent • Total fluxes from these areas can be constrained to some extent via calibration vs. streamflow and satellite observed inundation • Further constraint with ground observations is needed • Assimilating tower- and satellite-based observations should provide valuable constraints on simulated methane emissions
Thank You This work was carried out at the University of Washington and the Jet Propulsion Laboratory under contract from the National Aeronautics and Space Administration. This work was funded by NASA ROSES grant NNX08AH97G.