Download
1 / 24
240 likes | 261 Views
Utilizing a combination of IR and microwave data to develop statistically robust precipitation algorithms for accurate global monitoring. This method ensures temporal and spatial completeness while maintaining a pure microwave-based analysis.

E N D
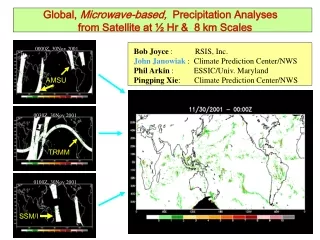
Global, Microwave-based, Precipitation Analyses from Satellite at ½ Hr & 8 km Scales 0000Z, 30Nov 2001 0030Z, 30Nov 2001 0100Z, 30Nov 2001 0000Z, 30Nov 2001 Bob Joyce : RSIS, Inc. John Janowiak : Climate Prediction Center/NWS Phil Arkin : ESSIC/Univ. Maryland Pingping Xie: Climate Prediction Center/NWS AMSU TRMM SSM/I
PassiveMicrowave (SSM/I, MSU, AMSU): • (+) considerably better estimate than IR – “sees” thru cloud and can directly sense information from hydrometeors • (-) poor temporal sampling (polar orbit platforms) Two primary types of precipitation algorithms: • Infrared(GPI, convective-stratiform, OPI) • (-) indirect - can only sense cloud-top temperature • (+) very good sampling characteristics (time & space)
Pessimist: “The food here is terrible!” Optimist: “Ah yes, but such huge portions!” • Pragmatist: Meld together the IR & microwave data to take • advantage of the strengths of each • Vicente (U. Wisc.) • Turk (NRL, Monterey) • Adler and Huffman (NASA/GSFC) • Kuligowski (NOAA/NESDIS) Microwave & IR data Combined statistically
Our Approach • Use the IR and microwave data but do NOT mix them • Use the IR only as a transport and “morphing” mechanism • Here we use precipitation algorithms developed by Ferraro (NESDIS: AMSU-B & SSM/I) and Kummerow (CSU: TRMM) but method is algorithm independent. • Enables the generation of spatially and temporally complete precipitation fields while maintaining a pure, albeit manipulated, microwave-based analysis
“Advection vectors” are computed from IR for each 2.5ogridbox andall microwave pixels contained in that grid box are propagated in the direction of that vector 2.5o 2.5o
IR (t+1/2 hr) IR Spatial Correlation Domain for Computation of “Advection Vectors” 2.5o IR (t+0) 2.5o precip
ZONAL Advection Rates for 00Z 30 Nov 2001 |………………. EAST …………|………… WEST ………………| (pixels/hour) MERIDIONAL |………………. NORTH ……...|…………SOUTH ………………| (pixels/hour)
t+1/2 hr t+1 hr t+1.5 hr Interpolated “observations” t+1/2 hr t+1 hr t+1.5 hr Time interpolation weights 0.50 0.75 0.25 0.25 0.50 0.75 IR t+ 1/2 hr t+1 hr t+1.5 hr Actual Microwave Observations t+0 t+2 hrs
Valid time is 5 hours after the “initial” pass and 2.5 hours before the “next” pass Microwave estimates propagated byIR. Microwave data from overpasses between the “initial” and “next” overpasses were withheld in this test to assess the performance of the technique. Validating analysis is in the lower-center frame. Validating analysis, ie. the microwave pass between the “initial” and “next” microwave passes that was withheld. Initial microwave pass Next microwave pass
Satellite Radar
Microwave-Advected GPCP “1DD” GPI (IR)
Potential Applications • Real-time quantitativeglobal precipitation monitoring • Disaster mitigation • Provide timely updates for U.S. interests abroad • Numerical model initialization & validation • Improve diurnal cycle in the models • Diagnostic studies: diurnal cycle in particular
Continuing Work • Account for precipitation that forms and dissipates between microwave overpasses • Refine advection vector computation • Continue validation effort • Test/Include new precipitation products as they become available – method is not restricted to particular algorithms or sensors
mm/day Figure 5
Microwave propagated by IR Another test – this one is over The South Atlantic Convergence Zone (SACZ) Valid time is 1.5 hours after the “initial” pass and 6 hours before the “next” pass Initial microwave pass Next microwave pass Validating microwave data
Spatial Lag Correlation of IR pixel temperature among nearby 5o x 5o grid boxes to determine propagation direction (t + 1/2 hr) (t + 0 hr) 5o + 12 pixels 5o 5o 5o + 12 pixels