Insights into Natural Hazards and Disasters: Comparisons, Analysis, and Impacts
360 likes | 422 Views
Explore the world of natural hazards and disasters, analyzing factors influencing their impact, frequency, and human costs. Learn about the deadliest and costliest hazards globally, and assess methods to classify and evaluate these events.

Insights into Natural Hazards and Disasters: Comparisons, Analysis, and Impacts
E N D
Presentation Transcript
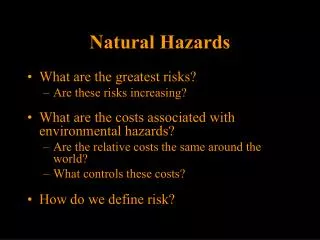
Natural Hazards? • What is a Natural Hazard? Aspects of the physical world that have the potential to cause considerable harm to others. • What is a Natural Disaster? A Natural hazard is activated and causes harm to humans and destroys or damages their communities. *Natural disasters around the world have been causing more deaths and injuries and wiping out more buildings and cultivated land than ever before. *Disasters occur in those areas of the world that are most heavily population.
Comparison and Analysis • Any one disaster can be described by analyzing various factors that determine how great an impact it will have on people • This system recognizes six main factors
Comparison and Analysis • Frequency • how often is the event likely to happen • Duration • the length of time the event lasts • Extent • Size of area or region affected • Town? Continent? Region?
Comparison and Analysis • Speed of onset • sudden, without warning, over quickly? • build slowly before a peak period • Spatial dispersion • area likely to be affected by a particular event • Temporal spacing • how hazards and disasters occur in time; are they random or do they occur within a cycle
Storm Stories… • Create a hazard event profile for the remaining hazards. Use the information from the following storm story videos, your brain, and pages 78-79. Also, pass in a brief response (to the three stories). This response should include a short summary of what happened, and a list of the characteristics & effects of the hazard. • Flood • 2. Tornado • 3. Hurricane
Hazard Assessment • Evaluate the potential for a hazardous process • Lots of money being made! • Lawyers, geophysicists, geologists, environmental scientists, geographers • Interpret history, simulate process, monitor modern activity, model future event magnitudes, frequency, recurrence intervals • “16% chance of M-7 rupture in California in next 30 years”
Methods of Classification • Calculating human costs • Impact measured by: • loss of life (total deaths) • number of injuries • damage to property (replacement costs)
Which hazards are deadliest? (All historical records) • Flooding • Earthquakes-tsunamis • Hurricanes are next
Top 10 Deadliest Natural Disasters in past 50 years Yellow River flooding in China in 1887, 1931, 1938 took up to 2 Million, 4 Million , and 0.9 Million lives Various sources, incl Wikipedia,
World’s Deadliest Hazards(1947-1980) Based on data from Abbott, Natural Disasters, 6ed But, in US and Canada: Most: Severe Weather (Heat, Freezing Rain) Second most: Tornado Third most: Lightning Fourth most: Flood Fifth most: Hurricane Earthquake Landslide Snow Avalanche KBC textbook-Table 1.1
The fatality-location relation (1947-1980) Why? Based on data from Abbott, Natural Disasters, 6ed
Canada Natural Disaster Fatalities Ice Storm 5-Jan-1998 26 Source:"EM-DAT: The OFDA/CRED International Disaster Database, Université catholique de Louvain, Brussels, Belgium" <2003
Which hazards are costliest? • Hurricanes and typhoons are most costly • Earthquakes are next • Winter storms
World’s most CO$TLY Disasters Insurance costs Based on data from Abbott, Natural Disasters, 6ed 2005 $US Billions $45 2004 Aug Hurricane Katrina $21 1992 Aug Hurricane Andrew $17 1994 Jan Northridge Earthquake $11 2004 Sep Hurricane Ivan $10 2005 Oct Hurricane Rita $10 2005 Oct Hurricane Wilma $ 8 2004 Aug Hurricane Charley $ 8 1991 Sep Typhoon Mireille (Japan) $ 7 1990 Jan Winter storm Daria (Europe) $ 7 1999 Jan Winter Storm Lothar (Europe) (Mostly storms) USA, Japan, Europe…WHY??
What factors control damage? • Haiti (M7) • Port-au-Prince (700,000) • 230,000 dead • $Hundreds of millions damage (little insured) • Chile (M8.8) • Santiago (5,300,000) • 400 dead • $4 to 8 Billion • New Zealand (M7.1) • Christchurch (370,000) • 0 dead • $1.4 Billion Population Population density Infrastructure Building codes Magnitude of hazard Intensity of hazard Style of hazard
Canada’s most costly disasters Canadians at risk: Our exposure to natural hazards Canadian Assessment of Natural Hazards Project February 2010 Hurricane Juan: $113M
Summary of Deaths and Costs • More deaths in densely populated regions • More costs in developed regions • Globally, floods, earthquakes (+tsunami) and hurricanes are most deadly, but not for North America • Hurricanes and other storms have caused most damage • There is an increasing trend in the number of deaths and amount of damage • We need to consider the data sources, reliability, and meaning when considering history of disaster costs
Methods of Classification • Strength/size/intensity of event • Hurricane system (Saffir Simpson scale) • Tropical depression, tropical storm, category 1-5 • Tornadoes (Fujita Scale) • Force 1-5 • Earthquakes (Moment Magnitude Scale) • Scale of 1-9, with 9 being cataclysmic, worldwide event • Epidemic, pandemic
Methods of Classification • Regional occurrence • Hurricane (Atlantic) • Typhoon (Pacific rim) • Monsoon (Asia, Africa) • Frequency of occurrence • Annually? • Centenially?
Disaster Categories • We classify natural disasters by the chief process or sphere in which it operates • Ex: Atmosphere, biosphere, lithosphere • This system has three categories
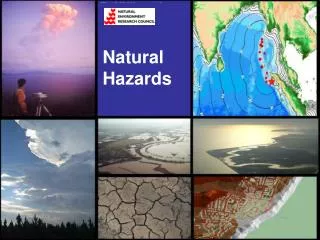
Atmospheric Hazards Cyclonic Storms (hurricane, typhoon, cyclone) Tornado (twisters, dust devils) Severe Storm (White Juan, Nor’easter) Flooding (heavy rains) Drought (lack of rain, prolonged high pressure) Wildfire (wind, lightning) Severe Weather (hot/cold) ex: ice storm
Biological Hazards Infectious Disease • HIV, H1N1, Bubonic Plague Parasitic Disease • ringworm Insect Infestation • malaria, West Nile virus
Geological Hazards Slide (mud, land, rock) Volcanic Activity Earthquake Avalanche Tsunami (tidal wave)
Hazards’ Human Costs • Every year natural disasters leave… • 4,000,000 homeless • 46,000 injured • 5520 dead • These figures do not include the recent tsunami in Asia (273,000) and Hurricane Katrina (1000) Source: The International Red Cross
Vulnerability • Vulnerability = susceptibility to injury or attack • Human vulnerability leads to financial, structural, and human losses. • Natural hazards only occur in inhabited areas • A natural disaster in an uninhabited area has little tangible impact on people • Natural hazards are increasing because of… • Population growth (more people) • Urbanization (lots of people in small spaces) • alteration of the natural environment (manmade islands)
Positive Effects • natural disasters have beneficial ecological consequences. • rejuvenation of a coniferous forest months and/or years after fires • recharging of groundwater stocks after a flood). • benefits tend to become apparent months or years after an extreme event