Download
1 / 19
190 likes | 207 Views
This study aims to predict and correct biases in radiosonde temperature measurements using a regression model. Offline and online methods are employed, and pressure, solar elevation, and logarithmic predictors are evaluated. Results show that the linear regression model with solar elevation and logarithmic predictors yields comparable results.

E N D
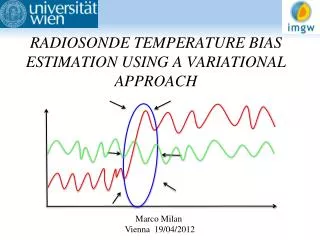
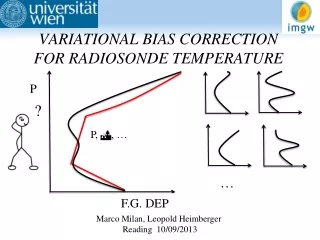
VARIATIONAL BIAS CORRECTION FOR RADIOSONDE TEMPERATURE P ? P, Q, … … F.G. DEP Marco Milan, Leopold Heimberger Reading 10/09/2013
MOTIVATION/OUTLINE • Changes bias due to: • Change of radiosonde • Change of locations for the same radiosonde • Other equipment changes • We want to predict the radiosonde bias! • Predictand => radiosonde bias • Predictors => every available quantity which bias depends on • Develop a regression model for one sonde type • Offline – using available background departure statistics • Apply the regression model • Offline – using available background departure statistics • Online – applying VAR-BC on IFS • Results
VARIATIONAL BIAS CORRECTION • Standard 4DVAR cost function: • The minimization of the cost function produces an adjustment to the model background based on all used observations • Errors in the input [y-h(xb)] arise from: • Errors in the actual observations • Errors in the model background • Errors in the observation operator • The bias can be computed using the average of the background departure: • Split the observation constraint in a bias one and in a bias corrected one Background constraint Observational constraint
VARIATIONAL BIAS CORRECTION • The observations are considered biased, a linear predictor model is used as observation operator in the 4DVAR equations: • Introduction of a “bias term” in the variational cost function • With xb and bba priori estimations of model state and bias control parameters • A large Bballows the parameter estimates to respond more quickly to the latest observation, a sensitivity test is needed. • The adjustment of the radiosondes depends on the resulting fit of the analysis to all other OBS, given the background from the model.
VARIATIONAL BIAS CORRECTION • Bias in observations can change during the time • Seasonal and daily variations in bias exist • The bias model : PREDICTORS must be chosen according to observations and physical origins of the bias. • We assume the model unbiased, the presence of model bias attributes a wrong bias to the observations where there are not enough observations to correct the analysis
CHOICE OF PREDICTORS OFFLINE • Assumption => BIAS equal to the mean of first guess (FG) departure • Goal => approximation of the FG departure • Predictors determination • Multiple linear regression using the predictors and the FG departures of the output of the operational version of IFS as predictand (data from Hans Hersbach - ECMWF) • Previous test using ERA-INTERIM data. • Optimal fit derived from RMSD between fit and the data (search of minimum), using the possible lowest number of predictors ONLINE (in doing) • Implementation of the clustering method based on the sound type • Apply the optimal predictors to the VAR-BC • Evaluation of the Bias
PRESSURE DEPENDENT PREDICTORS • Radiosonde temperature FG departure depends on pressure. • Three constant predictors for: • 10-50 hPa (Pred3) • 50-150 hPa (Pred2) • 150-700 hPA (Pred3) • 700+ hPa (Pred4) • (pred4) Value 1 in the range [850, 1000] hPa, interpolation from 1 to 0 in the range [ 700,850] • (pred1) value 1 in the range [300,700] hPa, interpolation in the ranges [700,850] and [200,300] • …
SOLAR ELEVATION DEPENDENT PREDICTORS • Radiosonde temperature FG departure in the stratosphere depends on solar elevation value. • Find a polynomial function and compute RMSD with the FG departure. • Compute RMSD for all sonde_type with more than 10000 values between 2000 and 2010 • We decide for an order 3, 3 new predictors (Q,Q²,Q3), in the stratosphere.
LOG PRESS DEPENDENT PREDICTORS • We tested also a predictor function of the pressure but with a logarithmic behaviour with p0 the soil pressure
OFFLINE EVALUATION OF PREDICTORS • With the data of ERA-INTERIM check the predictors and their combinations, fit using a linear regression • Fix predictors are the four pressure dependent (linear) • Add: • Log press • Log press only on the stratosphere • Three predictors depending on solar elevation in the stratosphere. • Check using all data
OFFLINE EVALUATION OF PREDICTORS BIAS MODELS • LINEAR • LINER + LOG • LINEAR + SOLAR ELEVATION (only in the stratosphere) • LINEAR + SOLAR ELEVATION + LOG • LINEAR + SOLAR ELEVATION + LOG. STRAT.
OFFLINE EVALUATION OF PREDICTORS • Apply the parameters gained from linear regression to the data with solar elevation in the ranges: • Q< -7.50 • Q ]-7.50 , 7.50] • Q ]7.50 , 22.50] • Q>22.5 • Check the behaviour of the predictors for different solar elevations
OFFLINE EVALUATION OF PREDICTORS • Mean of RMSD between linear regression and first guess departure over all sonde types. • Check also for different solar elevation ranges. • Pressure less than 850hPa and in the stratosphere • The four linear predictors give results comparable to the other setup of predictors (for all data) • Some improvements using solar elevations
CONCLUSIONS AND OUTLOOK • Offline fit useful to find the optimal predictors before assimilation • First results with predictors combination have good results • Varbc answer to the predictors (not shown) is also promising • Varbc online with linear predictors and solar elevations predictors • New predictors to test, one using a tropopause layer • Clustering
THANK YOU FOR YOUR ATTENTION Courtesy of ElkeRustemeier
QUESTIONS • Definition of the matrix Bb • RMS • ERA-INTERIM
DEFINITION OF Bb • We do not know the actual error covariances of b (Bb) • We use Bb to control the adaptivity of the bias parameters: • Increase Bb for faster bias adjustments; decrease for slower adjustments • We take diagonal Bbrelated to the diagonal of R: for i=1,…,Nj number of predictors for the variable j • In this way the part in the cost function related to the bias parameter background constraint for the variable j has the same weight as Mj new observations.
RMS firstguessdepartureT Night Q< -7.5° • The negative departures do not counteract the positive departures • RMS give more weight to the larger first guess departure • The Russian stations has larger RMS in the upper levels and near 200 hPa • Japanese’s stations RMS in the upper levels larger for higher solar angles • USA stations better than Russian’s and Japanese’s for Q > 22.5° • Groups for different stations are desirable Q > 22.5°
OFFLINE EVALUATION OF PREDICTORS • Mean of RMSD between linear regression and first guess departure over all sonde types. • Check also for different solar elevation ranges. • Pressure less than 850hPa and in the stratosphere • The four linear predictors give results comparable to the other setup of predictors (for all data) • Some improvements using solar elevations for particular solar ranges