Download
1 / 30
300 likes | 322 Views
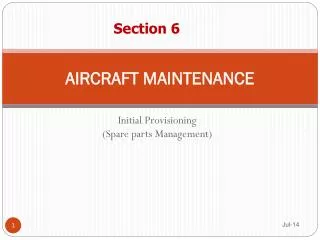
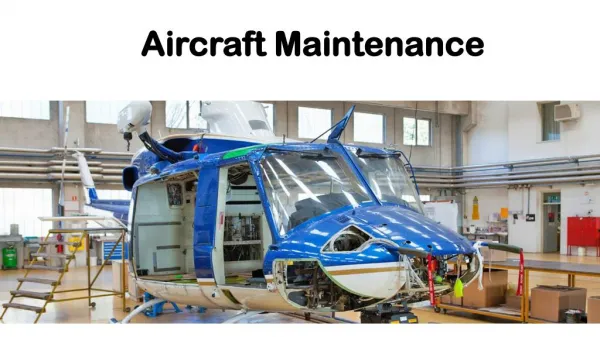
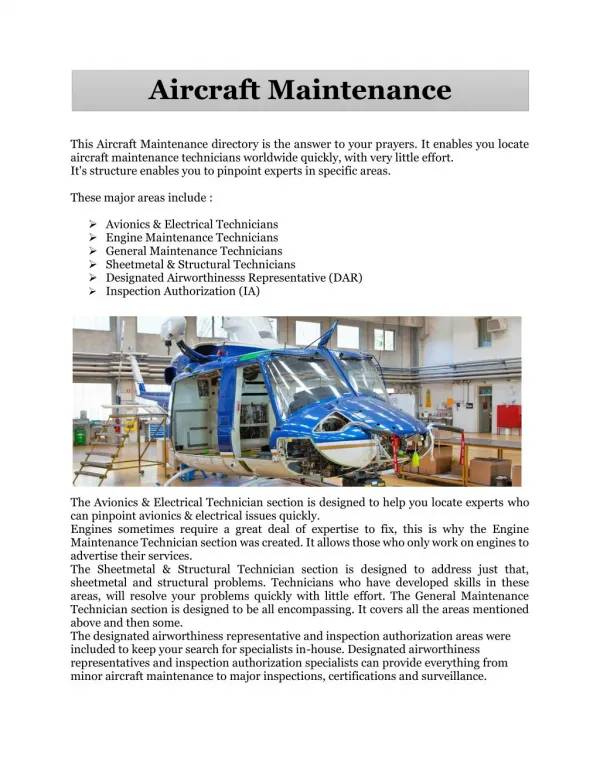
HEARING LOSS IN AIRCRAFT MAINTENANCE TECHNICIANS. Maya Guest1, May Boggess2 1 Faculty of Health, University of Newcastle, Australia. 2 Department of Statistics, Texas A&M University, College Station, USA. F111, a flying fuel tank. Deseal, then reseal a fuel tank.

E N D
HEARING LOSS IN AIRCRAFT MAINTENANCE TECHNICIANS Maya Guest1, May Boggess2 1 Faculty of Health, University of Newcastle, Australia. 2 Department of Statistics, Texas A&M University, College Station, USA
Deseal, then reseal a fuel tank • The fuel tanks were a confined space • They were very cramped, with tradespeople crawling around the braces
Health Concerns • Concerns about various symptoms experienced by workers were raised in early 1999 with symptoms including: • memory loss • fatigue • neurological problems eg. colour vision • Deseal/reseal activities ceased in 2000 • The SHOAMP Study
The SHOAMP Study • Aims • compare series of general health, medical and neurophysiological outcomes between F-111 deseal/reseal personnel and appropriate comparisons • Research Question • Is there an association between adverse health status and an involvement in F-111 deseal/reseal activities? • Study Design • Retrospective cohort; postal questionnaire & exam
Study Group • Exposed group • in Deseal/Reseal program at Amberley • N = 616 • Two comparison groups • same time, but in non-technical at Amberley • N=406 • same time, but in technical at Richmond • N=516 • Total health exams • N=1538
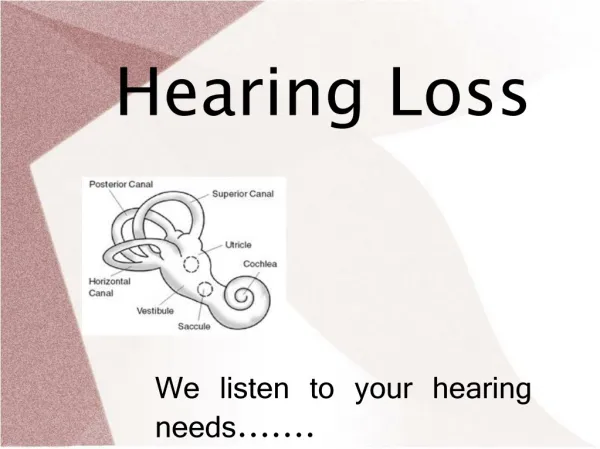
Measuring Hearing Thresholds • Pure-tone audiometry at the frequencies of 0.5, 1, 2, 3, 4, 6, 8 kHz for air conduction • Australian Standard AS1269.4.1998 by trained nurses • Measures threshold dB (smaller is better)
How to compare groups? • Treat each frequency separately • Do 95% confidence intervals for each group overlap?
Problems • 16 observations on single person will be correlated • Distribution heavily skewed • Multiple test correction (eg. Bonferroni) needed to control overall error rate • Other factors need to be controlled for AGE!
The ISO-7029 • The ISO-7029: statistical distribution of hearing thresholds as a function of age provides by gender the expected median value of hearing thresholds relative to the median threshold at the age of 18 years and the statistical distribution above and below the median value for the range of audiometric frequencies from 125 Hz to 8000 Hz for populations of otologically normal persons of given age between 18 and 70 years
Quantile model? • Mean regression: coefficients estimated by minimizing the sum of the squares of the residuals • Quantile regression: coefficients estimated by minimizing the sum of the absolute values of the residuals
Quantile model? • Mean regression: 1821 Gauss showed it was ML, least variance IF residuals are normal. • Quantile regression: 1818 Laplace showed it had smaller variance than mean for certain distributions with long tails. • Central Limit Theorem is not a cure all.
Statistical Analysis: quantile model to compare to normal population • Response: hearing threshold (dB) • Explanatory variables: • Frequency, Age • Posting category, Rank category • Alcohol consumption category, Smoking status • Diabetes status • SSRI’s (anti-depressants), malaria medication • Ringing in the ears • Exposure group, civilian solvent exposure • Bootstrap standard errors: correlation within person.
Statistical Analysis: quantile model to compare to normal population • Statistically significant explanatory variables: • Frequency, Age • Smoking status, Diabetes status • SSRI’s (anti-depressants) • Ringing in the ears • Exposure group • Clinically significant variables: • Frequency • Age
Result table ------------------------------------------------------------------------------ | Coef. Std. Err. z P>|z| [95% Conf. Interval] -------------+---------------------------------------------------------------- _Ifrequen~10 | -1.051308 .3152126 -3.34 0.001 -1.669113 -.4335024 _Ifrequen~15 | -.6029429 .3331257 -1.81 0.070 -1.255857 .0499715 _Ifrequen~20 | -1.881937 .3809262 -4.94 0.000 -2.628539 -1.135336 _Ifrequen~30 | .8669362 .4485159 1.93 0.053 -.0121388 1.746011 _Ifrequen~40 | 7.536735 .4582282 16.45 0.000 6.638624 8.434846 _Ifrequen~60 | 8.997418 .3901236 23.06 0.000 8.23279 9.762046 _IfreXg~40_2 | -2.720623 .9044762 -3.01 0.003 -4.493363 -.9478817 _IfreXg~60_2 | -2.208105 .8227658 -2.68 0.007 -3.820696 -.5955134 _IfreXg~80_2 | -3.32165 .7481134 -4.44 0.000 -4.787925 -1.855374 age | -.4541155 .2376783 -1.91 0.056 -.9199565 .0117254 age2 | .006715 .002729 2.46 0.014 .0013662 .0120638 frequency | .2533864 .1252859 2.02 0.043 .0078305 .4989422 fa | -.0225578 .0058333 -3.87 0.000 -.0339908 -.0111248 fa2 | .0004074 .000067 6.08 0.000 .0002761 .0005387 _Ismoke_ca~3 | 1.7394 .5696168 3.05 0.002 .6229713 2.855828 diabetes | 5.374096 1.413524 3.80 0.000 2.60364 8.144552 ssri | 5.298353 1.240201 4.27 0.000 2.867604 7.729102 ringing | 3.350579 .4439917 7.55 0.000 2.480371 4.220787 _cons | 18.82656 4.990258 3.77 0.000 9.045838 28.60729 ------------------------------------------------------------------------------
Conclusion • Need to reconsider noise exposure limits if workers are additionally exposed to chemicals • Need to reconsider the efficacy of hearing protectors in combined exposures
Take home message • No one-size-fits all in statistics • Central Limit Theorem is not a cure-all
Principal Investigators Catherine D’Este, Associate Professor in Biostatistics, Centre for Clinical Epidemiology & Biostatistics, The University of Newcastle. John Attia, Senior Lecturer in Epidemiology, Centre for Clinical Epidemiology & Biostatistics, The University of Newcastle; Academic Consultant, Hunter Area Health Service Anthony Brown, Director of Primary Health Care and Population Health, Macquarie Area Health Service; Conjoint Associate Professor, Environmental and Occupational Health, The University of Newcastle. Julie Byles, B.Med, PhD, Professor and Director, Centre for Research and Education in Ageing (CREA), Faculty of Health, The University of Newcastle. Associate Investigator Robert Gibberd, Associate Professor, Centre for Clinical Epidemiology & Biostatistics, The University of Newcastle. CEO of TUNRA Ltd Soozy Smith, PhD, TUNRA Ltd, The University of Newcastle. Project Support Meredith Tavener, Project Manager. Richard Gibson, Associate Lecturer in Biostatistics (Research), Centre for Clinical Epidemiology & Biostatistics, The University of Newcastle, Project Statistician. Maya Guest,. Research Higher Degree candidate, PhD Fellow for SHOAMP. The TUNRA Study Team