Download
1 / 37
370 likes | 390 Views
Join Kerry Friedman, Patrice Linehan, and Jenna Nguyen in this virtual workshop on April 4, 2019, to enhance your infographic skills. Learn to communicate key elements effectively, discover tools for development, and share impactful visuals with stakeholders. This interactive session covers infographic design principles, checklist for review, development steps, and tips for using Venngage. Engage with peers, create engaging infographics, and boost your data storytelling prowess. Don't miss this valuable opportunity to upskill and revolutionize your infographic creation process.

E N D
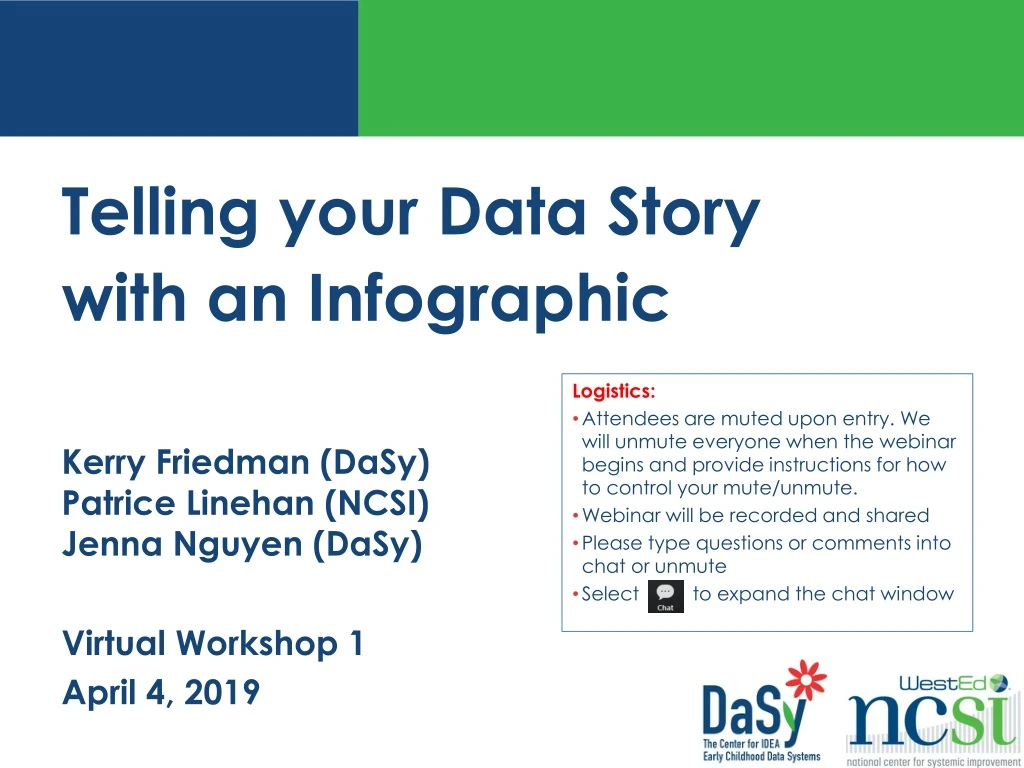
Telling your Data Story with an Infographic Logistics: Attendees are muted upon entry. We will unmute everyone when the webinar begins and provide instructions for how to control your mute/unmute. Webinar will be recorded and shared Please type questions or comments into chat or unmute Select to expand the chat window Kerry Friedman (DaSy) Patrice Linehan (NCSI) Jenna Nguyen (DaSy) Virtual Workshop 1 April 4, 2019
Workshop Facilitators Kerry Friedman Patrice Linehan Jenna Nguyen
Workshop Objectives • By participating in two workshops, you will: • be able to communicate the key elements of an effective infographic. • build awareness of tools and resources to support infographic development. • develop an effective infographic to share information with stakeholders.
Our Time Together… • Workshop expectations • Introduction to infographics • Process for developing infographics • Introduction to Venngage • Evaluation & Next steps
The workshops are not… • A lecture or webinar series
The workshops are… • A place to engage with peers around common goals
The workshops are not… • A passive activity
The workshops are… • A place to get support from and support others
Poll • Who’s in the room? • If you select other, right your title/organization in the chat.
Poll • From 1 to 4, how comfortable are you creating infographics? • 1: I’m brand new to developing infographics and can use all the help I can get. • 2: I’ve tried creating infographics, but I’m not yet confident in my abilities. • 3: I’ve created a few infographics and others seem to find them helpful. • 4: I’ve created some awesome infographics and shared them with a range of stakeholders.
https://visual.ly/community/infographic/technology/infographics-benefits-their-use-onlinehttps://visual.ly/community/infographic/technology/infographics-benefits-their-use-online
The Value of Infographics • Communicate data and context • Synthesize main ideas and combat information overload • Can be used to build interaction • Provide simple, shareable pieces of information • Help many to ‘own the change’ and express the ‘what’ and ‘why’ within their own networks
5 Infographic Design Principles • Communicate one central idea • Communicate the data clearly • Create Levels of Engagement • Make it easy to navigate • Keep it beautiful
Create Levels of Engagement • https://elearninginfographics.com/wp-content/uploads/How-Far-Behind-Are-We-On-Preschool-Infographic.png
Checklist for Reviewing Infographics • Story • The message is clear and includes the who, why, and what • Content • Includes the elements of a story: title, intro, main points, conclusion, and credit • Design • Design supports the story. Includes layout, color, font, etc. • Visuals • Visuals bring life to the story through images, icons, data displays, photographs, and illustrations Source: https://magnoliaconsulting.org/wp-content/uploads/2017/10/Checklist-for-Reviewing-Infographics.pdf
Infographic Development • Step 1: Plan • Answer WH questions • Gather data and information that tells the story • Determine visual layout • Step 2: Design • Choose or design a template that matches your vision • Input content (remember to credit your sources) • Get feedback, review and finalize infographic • Step 3: Distribute • Distribute infographic to intended audience(s)
Determine Visual Layout Scribble Browse Scribble
Infographic Development • Step 1: Plan • Answer WH questions • Gather data and information that tells the story • Determine visual layout • Step 2: Design • Choose or design a template that matches your vision • Input content (remember to credit your sources) • Get feedback, review and finalize infographic • Step 3: Distribute • Distribute infographic to intended audience(s)
Tutorial for Venngage • Using a free site through 9/30: www.venngage.com
Browse the Available Templates • Consider the type of message you want to convey • Select a template from the free options to preview or ‘create’ • Watch the ‘onboarding’ videos for help
Add widgets to your Infographic • Drag and drop charts, icons, maps or text onto your infographics. • You can show or hide each category by clicking on the arrows. • Click on any text, image or icon to edit it or double click to edit charts.
Continue to Edit and Refine your Work • Click on any widget to edit. • Use the buttons to edit, copy, and move items to the front/back or to delete them.
Publish and Share your Infographic • Save your work. • Create and name a folder. • Drag the infographic to the folder.
Evaluation Break! https://unc.az1.qualtrics.com/jfe/form/SV_e9vH7dBmBXG1HM1
Next steps • Post your infographic development workshop to the padlet: https://padlet.com/kerry_friedman/infographicsworkshop • Work on your infographic in Venngage. Reach out for help as needed. • Finish your draft infographic by May 9. Peruse the other infographics in the Venngage folder. • Participate in the workshop on May 16 for feedback and support on finalizing your infographic.
Contact Us Visit the NCSI website at: http://ncsi.wested.org/ Follow NCSI on Twitter: @TheNCSI • Visit the DaSy website at:http://dasycenter.org/ • Follow DaSy on Twitter:@DaSyCenter • Like DaSy on Facebook: https://www.facebook.com/dasycenter Presenters • Patrice.Linehan@nasdse.org • Kerry.Friedman@sri.com • Jenna.Nguyen@sri.com
Thank You! The contents of this presentation were developed under grants from the U.S. Department of Education, # H373Z120002 and H326R140006. However, those contents do not necessarily represent the policy of the U.S. Department of Education, and you should not assume endorsement by the Federal Government. DaSy Center Project Officers: Meredith Miceli and Richelle Davis. NCSI Project Officers: Perry Williams and Shedeh Hajghassemali.