Download
1 / 37
370 likes | 398 Views
Learn about the 3 energy systems - ATP/PC, Lactic Acid, and Aerobic - fueling muscle activity, their characteristics, and training implications for physical activity performance. Discover how ATP is regenerated from ADP to sustain exercise performance.

E N D
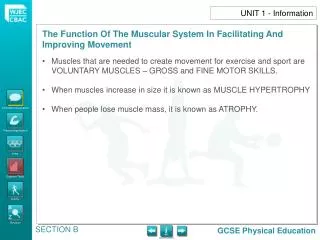
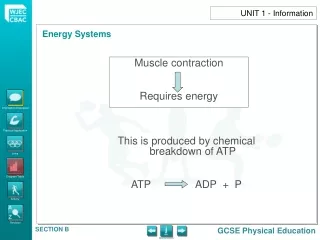
Muscle contraction Requires energy UNIT 1 - Information This is produced by chemical breakdown of ATP ATP ADP + P
There is a limited supply of ATP in muscle cells (it’s usually used up after 3 – 5 seconds of exercise) UNIT 1 - Information For exercise to continue, ATP has to be re-generated from ADP using energy obtained from other sources. ADP + P ATP Note: ATP: Adenosine triphosphate ADP: Adenosine diphosphate P: Phosphate
UNIT 1 - Information There are 3 sources (energy systems) that the body can use: 1.ATP/ PC or CP System Anaerobic Pathway 2. Lactic Acid System Aerobic Pathway 3. Aerobic System
CP – Stored in Muscles Combines with ADP to re-build ATP Immediate source of energy Limited source – lasts up to 10/15 seconds Very important for bursts of explosive speed Suitable for short duration events: 100m, throwing/ jumping athletic events. Phases of team game play. Replenishing stores of CP takes up to 6 minutes of recovery after end of exercise ADP + CP = ATP + C UNIT 1 - Information • The CP (Creatine Phosphate) System CP: Creatine Phosphate C - Creatine
UNIT 1 - Information • LACTIC ACID SYSTEM Glycogen made from glucose obtained from digested food present in all cells of the body – muscles, liver When glycogen breaks down it releases pyruvic acid and energy. This energy is used to re-build ATP from ADP and P This system is anaerobic – no O2 Pyruvic acid is easily removed when O2 is available Where there is little O2 it is changed into lactic acid Muscles fail to contract fully - fatigue Energy from this source lasts longer – up to three minutes before build up of lactic acid prevents further energy production Suitable for athletes – 200m – 800m. Games players who need to keep up continuous short bursts of activity Takes about 20 – 60 minutes to remove accumulated lactic acid after maximal exercise ADP + glycogen = ATP + Pyruvic acid (or pyruvic acid without O2)
UNIT 1 - Information • AEROBIC SYSTEM For longer events – muscles must work aerobically. O2 present This system can take the pyruvic acid produced when glycogen breaks down and turns it into more energy rather than lactic acid Supplies energy to athletes who are working sub-maximally at 60 – 80% of maximum effort and can take in a constant supply of O2 This system provides most of the energy required for physical activity lasting longer than about 3 minutes – long distance activity – runners/ cyclists – Games Players ADP + Glycogen = ATP + Pyruvic acid
UNIT 1 - Information • AEROBIC SYSTEM Graph to Show – Energy Released over Time % of maximum rate of energy production ATP Store ATP-PC System Lactic Acid System Aerobic System time 2sec 10sec 1min 2hrs
UNIT 1 - Information Characteristics of the 3 Energy Systems
UNIT 1 - Information Characteristics of the 3 Energy Systems • The importance of each source of energy for physical activity • depends on: • Type of physical activity. • Intensity of physical activity. • Duration of physical activity. • In many aspects of physical activity the 3 energy systems work • together at different times to supply the particular type of energy • needed.
UNIT 1 - Information Oxygen Debt • When all the ATP required for muscular contraction cannot be • supplied AEROBICALLY, the lactic acid system takes over. • The side-effect of the body using this system is that there is a • build-up of lactic acid in the muscles and CP stores are depleted • – causing fatigue. • After strenuous exercise the following have to be completed: • O2 stores replaced. • ATP replenished. • Lactic acid removed. • The need for extra O2 after strenuous exercise is known as the • O2 DEBT. • The body pays off this O2 debt by gulping air into the lungs and • panting. As a result, the lactic acid is turned into CO2 and water.
UNIT 1 - Information Training Energy Systems Individuals, teachers, coaches need to have a knowledge of energy systems to: Identify needs / demands of the physical activity. Aerobic Anaerobic Act upon those needs train correctly Continuous training Interval training To help in training effectively we should be able to use MHR (MAXIMUM HEART RATE) ) and VO2 MAX to establish the identified Training Zones and Training Thresholds. • Different methods: • Fartlek • Weight training • Circuit training • Flexibility training • Plyometrics
UNIT 1 - Information Training Energy Systems • To establish TRAINING ZONES the MHR has to be decided: • MHR Males = 220 – AGE • To gain AEROBIC fitness the exercise should be maintained between 60 and 80% of the established MHR. • e.g. 20 year old man • 220 – 20 = 200 • AEROBIC TRAINING THRESHOLD = 60% OF 200 = 120 HR • ANAEROBIC TRAINING THRESHOLD = 80% OF 200 = 160 HR • AEROBIC THRESHOLD is the level of exercise where the intensity is sufficient to produce a training effect. • ANAEROBIC THRESHOLD is the point where the Aerobic Mechanisms become overloaded and anaerobic metabolism begins to play a major role. • The thresholds do vary (marginally). • The training zone between 60 and 80% MHR is known as the AEROBIC TRAINING ZONE. • Exercising in the zone above the Anaerobic Training Threshold – 80% MHR, means you are in the ANAEROBIC TRAINING ZONE.
220 A 210 A - MHR B B – Anaerobic Training Zone 200 C – Anaerobic Training Threshold D – Aerobic Training Zone 190 E – Aerobic Training Threshold F – No Improvement Zone 180 C 170 G – Resting Heart Rate D 160 Heart Rate Beats per minute (BPM) 150 140 130 E F 120 110 100 90 80 G 70 (Resting heart rate) 60 UNIT 1 - Information Graph to show how the heart rate can be used to establish training zones and thresholds (For a 16 year old boy)
UNIT 1 – Practical Application • The energy continuum: • Small group/ larger group activity likely to involve different energy • systems e.g. a game situation. • Discussion in advance to consider different systems and their uses. • Recording of performances for analysis and discussion. • Partner and group recording of activity and uses being made of the energy systems during the game. • Data analysis of findings linked to training methods and sport specific demands. • Heart Rate Monitoring: • Pupils lead a warm up for a specific activity. • Pupils introduce and develop a skill micro session. • Heart rate monitoring taking place during each phase of the session. • Observation, analysis and discussion of the visible effects/ changes taking place.
UNIT 1 – Practical Application Example of energy systems used in a team game: • Netball Energy Systems: • Consider the type of preparation required for netball. • Pupil led warm up and pupil led skill micro session. • Review of the energy systems and their effects on performance. • Consider sport specific energy requirements linked to nutrition and hydration strategies. • Record netball game and analyse in relation to quality of performances, positional responsibilities and the different energy demands being made. • Consider the effects of intensity and duration of the activity e.g. sprinting, feint dodge, walking back to the restarting of play, and link to energy systems/ positional responsibilities. • Any physical activity could be used.
UNIT 1 – Practical Application • Pupils establishing a training programme based on: Identified needs Aerobic / anaerobic pathways Principles of training Monitoring the programme Using heart rate to establish training zones and thresholds Healthy lifestyles Performance Correct Training Methods
Heart Rate (beats per minute) Recovery Period 140 130 120 110 100 90 80 70 60 Normal heart rate 50 0 1 2 3 4 5mins End of swim Start of swim UNIT 1 – Practical Application How Heart Rate can Illustrate the Effect of Physical Activity Study the graph and answer the questions that follow.
Press to see graph again UNIT 1 – Practical Application How Heart Rate can Illustrate the Effect of Physical Activity The graph above illustrates the hear rate of a swimmer during a 100 metre race at the following stages: (i) normal; (ii) start; (iii) halfway; (iv) end of swim; (v) recovery. • Use the graph to answer the following questions. • By how many beats had the heart rate risen from normal to the end of the swim? • By how many beats had the heart rate increased from start to the halfway stage? • For how many minutes from the end of the swim did the heart rate • continue to rise? • During which minute was the biggest rise in heart rate? • What was the heart rate at the end of the swim? • Explain why the heart rate increased before the start of the race. • Select one test which measures a component of physical fitness. • Explain its purpose and conclusions that can be drawn from the results.
Exercise Heart Rate Upper and Lower Limits Of Training Heart Rate Target 200 Pulse Rate (beats per minute) 190 180 170 160 150 TRAINING ZONE 140 130 120 NO IMPROVEMENT ZONE 110 100 90 Age in years 20 30 40 50 60 UNIT 1 – Practical Application Training Zones / Thresholds Look at this graph of the recommended minimum and maximum training heart rates in beats per minute and answer the questions which follow.
Press to see graph again UNIT 1 – Practical Application Training Zones / Thresholds • What is the safe maximum training heart rate for a 20-year old? • What is the difference between maximum training and minimum training heart rate for a 35 year old? • What is the difference between the maximum training heart rate for a 50 year old and a 30 year old? • What is the difference between the maximum training heart rate for a 60 year old and a 25 year old? • What is the minimum training heart rate for a 40 year old? • Why is it important to work within the training zone for a given group? By working on this graph, pupils can use their own MHR to understand the importance of training correctly.
100 The effects of strenuous exercise on lactic acid concentration in the blood Lactic Acid concentration (per mg per 100cm3 blood) 80 60 40 20 Time (min) 10 20 30 40 50 60 UNIT 1 – Practical Application Effects of Lactic Acid Concentration in the Blood Look at this graph and answer the questions which follow. • How much did the lactic acid concentration increase during the period of exercise? • What was the level of concentration of lactic acid at the 30 minute point? • What time after the start of the exercise did the level of concentration of lactic acid read 44 mg per 100cm3? • Was the concentration of lactic acid cleared at the 60 minute point? • What was the level of concentration of lactic acid at the15 minute point? • What causes the increase of concentration of lactic acid in the blood?
Cardiovascular system Cardio-respiratory system Intensity/ duration of exercise Short term effects of exercise on the systems of the body Long term effects of exercise on the systems if the body Principles of training Methods of training Heart rate/ VO2 UNIT 1 - Links Information/Discussion Practical Application
UNIT 1 - Activity • During the course of a team game, players would use all three energy systems. • Name a team and describe specific situations in which each of the energy systems would be used. • Below is a table showing some characteristics of three energy systems used in sporting activity. • Tick () the energy system which is appropriate for each characteristic.
UNIT 1 - Activity • Identify one factor which can determine the main energy system used in any sporting activity. • Complete the table summarising the energy systems below:
UNIT 1 - Activity • Study the images below. Suggest which energy system each athlete would predominantly use during performance and why. A B C Long Jumper Marathon Runner 400m Sprinter • Select one energy system and explain how ATP is recreated using this system. You may choose to use a diagram to assist your explanation.
UNIT 1 - Activity • The table below shows a number of activities that are common to many games. For each activity identify the main energy system that would be used. • The energy system used for any sporting activity depends on which two factors? • How could an understanding of the energy systems help a teacher/ coach of a sports team train his/ her players?
UNIT 1 - Activity • “During maximum effort, such as sprinting, muscles need a lot of energy quickly but oxygen (O2) cannot reach the muscles fast enough”. • Which energy system is best used to provide the necessary fuel for such an activity? • Explain the term oxygen debt? • The following table lists a number of activities that a hockey player may perform in a game. Decide which energy system would be used to provide energy for them. Practical Application
UNIT 1 - Activity • “During maximum effort, such as sprinting, muscles need a lot of energy quickly but oxygen (O2) cannot reach the muscles fast enough”. • Which energy system is best used to provide the necessary fuel for such an activity? Aerobic Anaerobic Click box once for Anaerobic, twice for Aerobic Anaerobic Aerobic Anaerobic Aerobic Anaerobic Aerobic Anaerobic Aerobic Aerobic Anaerobic • Explain why many sporting activities can be described as both Aerobic and Anaerobic. • What is the advantage to a team game player of having a high VO2 Max?
UNIT 1 - Activity • Explain what is meant by anaerobic threshold. • Which energy systems would be the main provider of energy in a: • smash in Tennis, • 60 second rally in Tennis. • (i) Explain the meaning of the term VO2 Max. • (ii) Give two benefits for a sportsperson of having a high VO2 max. • (i) Give a sporting example of anaerobic activity. • (ii) Why is lactic acid produced during anaerobic activity? • What happens to an athlete’s performance as lactic acid builds up?
100 A B 80 60 % Blood Lactic Acid Removed 40 20 Recovery Time (minutes) 60 80 100 120 140 20 160 40 UNIT 1 - Activity • The graph shows the rate of lactic acid removal after exercise. (i) Which athlete recovered first? (ii) How long did it take the other athlete to remove all lactic acid from his body? (iii) How much lactic acid had been removed by A after 1 hour’s recovery? (iv) How much lactic acid had been removed by B after 1 hour’s recovery? (v) What is the difference in full recovery time between the two athletes? (vi) There is evidence on the graph to suggest why one athlete recovered quicker than the other during recovery time. Explain the evidence.
205 X 164 Y A Heart rate (bpm) 123 Z 60 15 20 25 30 35 5 40 10 Warm up 5 minutes Cool down 5 minutes Exercise – 30 minutes UNIT 1 - Activity • The graph below shows the heart rate of a 15 year old athlete during a training session. • What heart rate is indicated at 205 bpm? • What threshold is identified at Z? • What is the name given to training zone A? • What type of sporting activity could the athlete be training for? • What physical fitness component is being developed in this session?
250 200 Heart rate (bpm) X 150 Y Z 100 50 Time UNIT 1 - Activity • The graph below shows the heart rates (X,Y and Z) for three different performers. Which heart rate would be appropriate for (i) a 100 metre sprinter and (ii) a games player? Give reasons for your answers.
180 Heart rate (bpm) 120 90 60 0 30 Time (minutes) UNIT 1 - Activity • The graph below shows the heart rate of two 16 year old athletes when training at the same intensity. Athlete A Athlete B • Which athlete is the fitter, A or B? • Using information from the graph to help you, give two reasons for your answer.
MHR 200 180 160 140 Heart rate 120 Heart rate 100 80 60 40 20 0 Training Session UNIT 1 - Activity • The graph below shows the heart rate of a sportsperson recorded during a training session. • What happens to the sportsperson’s heart rate during the training session? • What causes the heart rate to change in this way? • What type of sporting activity do you think the sportsperson is training for? • Explain your answer.
250 200 Heart Rate Beats per minute (BPM) 150 100 50 Time (min) 5 10 15 20 UNIT 1 - Activity • The graph below shows the heart rate of an eighteen-year-old badminton player during a game. • Give two pieces if evidence to suggest that this player is a fit competitor. • Calculate the player’s maximum heart rate (MHR). • What evidence is there to suggest that this player worked both aerobically and anaerobically during the game?
UNIT 1 - Activity • The graph below shows how a sixteen-year-old sportsperson can use heart rate to work out how hard to train. • Heart rate and training of a sixteen-year-old sportsperson: • What heart rate is indicated at 204 bpm (A)? • What threshold is indicated at 163 bpm (C)? • What threshold is indicated at 122 bpm (E)? • In which training zone does lactic acid build up quickly? Is it B, D or F? • How does lactic acid build up affect training time and recovery time? • Which training zone is important for improving aerobic fitness? Is it B, D or F? • Explain why training zone F has little effect on aerobic fitness?
UNIT 1 – Key Facts/Glossary Muscle contraction ATP Energy Needed (CP System – Lactic Acid System) – Aerobic System Anaerobic Pathway Aerobic Pathway • Needs of individual – physical activity – health/ competitive? • Intensity/ duration of physical activity • Oxygen debt – lactic acid – fatigue – performance • Training correctly to meet identified needs/ demands • Heart rate – links with VO2 – establishing – training zones and thresholds