Download
1 / 65
650 likes | 688 Views
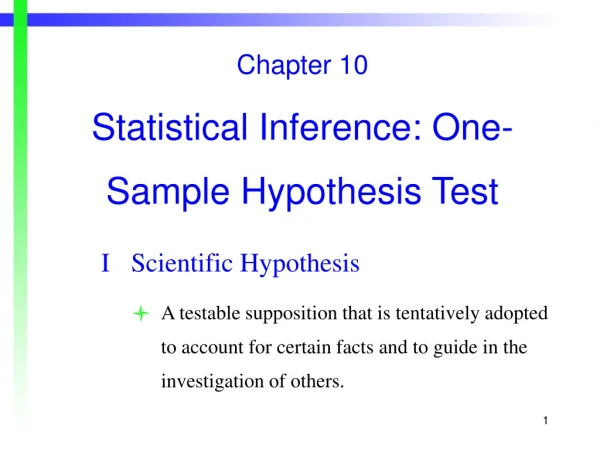
Understand parameter estimation, significance tests, and sampling distributions, with a focus on hypothesis testing principles and rare event analysis in statistical inference.

E N D
Hypothesis Test, HT statistical inference xiaojinyu@seu.edu.cn
Statistical Inference • parameter estimation • hypothesis test/ significance test
Review on parameter estimation • CLT • Sampling distribution of sample means • CI for population mean
A Simulation Study Original population μ SAMPLE 1:x11 x12 x13 x14...x1n SAMPLE 2:x21 x22 x23 x24...x2n SAMPLE k:xk1 xk2 xk3 xk4...xkn Histogram of sample means
X X X X Population A Population B Population C Population D n=2 n=4 n=10 n=25 Sampling Distribution of sample means Sampling Distribution of sample means Sampling Distribution of sample means Sampling Distribution of sample means Sampling Distribution For Means
Finding Probability For Sampling Distribution N(μ, σ2)————————————— N(0, 1) ————————————— N(0, 1)
transform N(μ,σ) to N(0,1) • if ,then
t-Distribution • In practice we rarely know of the population, so we use sample sd as an estimate. • For large n, it is acceptable. (normally distributed) • For small n, Z does not work.
We know the sampling distribution of means:95% sample means will fall in • when sample size big enough • When sample size Small
Example 2 Height data set of 10 female students of age 20, mean 54.80kg,SD 4.39kg,find 95% and 99% confidence interval population mean of height of female students of age 20。 • =10-1=9,find in t-table t0.025,9=2.262, t0.0051,9=3.25 • 95%CI 44.87~64.73kg , • 99%CI 40.53~69.07kg
Main Contents • Basic Idea of hypothesis test • hypothesis test regarding means • Single sample design or paired design • Completely random design • Condition of application • Some conceptions
Statistical Inference • parameter estimation • hypothesis test/ significance test
Estimate and test • “Estimate” means providing a substitute for an unknown truth. • guessing with probability • the amount of uncertainty In the estimate. • a number measuring the margin of error. • the best guess and how wrong the guess could be, in precise terms. • For example 95% confidence interval
Basic idea of Hypothesis test • Rare event principle • Reduction to absurdity • Sampling distribution of sample statistics
Fair coin, fairly toss • Head and tail
Your outcomes from 3 tosses if the coin is fair, P=0.5x 0.5x0.5=0.125
Your outcomes from 10 tosses if the coin is fair, P(geting head for ten times)=0.510=0.00098 Do you believe that the coin is fair?
Rare Event principle • We judge rare event will not happen in a trial. Theoretical foundation:the principle of small probability. P ≤0.05 or 0.01 or is small probability.
THE IDEAL OF HT • State the null hypothesis H0; • IF H0 is true, Could we got the data? Two possibilities: • We got the sample with small probability Reject H0 • We have chance to got the sample (not small probability) do not reject H0
Example7.1 Sample:25 female patients were randomly selected, and their Hb of blood were tested. The mean of Hb is 150g/L,and the sd 16.5g/L. Question: Do these data provide sufficient evidence to indicate that the mean of Hb of all of female patients who suffer from the same disease is different from the mean of Hb of normal female (The mean of Hb of normal female is 132g/L)。
Problem • is the population mean of HB in female patient is different from that of normal female? • Yes, different • No , I mean
Hypotheses The mean of Hb of patients is same as the mean of Hb of normal female.
Significance level α=0.05 • If H0 is true the sample mean should be closed to 132 • If the H1 is true, a sample mean will be expected to be significantly different (greater or lower than) from 132. • Significant different means that the result of experiment will be rare results if the H0 is true. • What is the rare result or rare enough result to be suspicious of the null hypothesis? • We define 0.05 or 0.01 as the probability of rare result. That is significance level.
Is the sample mean significant different from 132? • We do not know the probability of sample mean when H0 is true? We can transform it to d t deviation.
P-value • The probability of sample result or one more extreme when the H0 is true. • t=5.4545 ν=25-1 p=? • t0.025,24=2.064 α=0.05
Critical values Theoretical background:t score v=24 5.4545 -2.064 0 2.064
Rejection region Rejection region Critical values Rejection & Acception region acception region - t/2 0 t/2
Inference based on P • If H0 is true, the sample mean 150 is rare event. • How large the probability we get so big difference? • That means that when H0 is true, that t value falls in the interval lower than 5.545 that is rare event. • We judge rare event will not happen in a trial.
(5) Statistical conclusion • Based on the principle of small probability. • rare event (with small probability), we think it cannot occur in one trial. • P>0.05, not rare event. No evidence to reject the H0. • P≤0.05, rare event. Reject H0;accept H1。
The difference between • If H0 is true, sampling error (by chance, random, small) Sample is drawn from the hypothetical population. • If the H0 is not true, the difference represents that between different populations. (certain, large) Sample is drawn from a different population from the hypothetical population.
2 practical results. • H0 is true. The difference is from random error. • H0 is not true, The difference of the means is due to the difference of population.
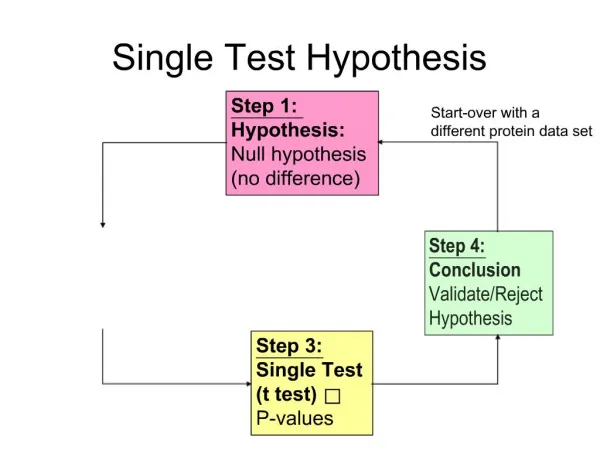
5 Steps of hypothesis test: • State the null hypothesis H0: 1=0vs the alternative hypothesis H1: 1 0. • Choose a significance level = 0.05 • Compute the teststatistic. (t value) • Statistical inference: base on P value: Reject the null hypothesis if the test statistic falls in the rejection region; otherwise, do not reject the null hypothesis. • Conclusion.
Solution to Example • Hypothesis: H0 : 1= 132; H1 : 1 132 • =0.05。 • Test statistic: • P < 0.05, Reject the H0 at the level of =0.05. the difference is statistically significant. • Conclusion: The mean of Hb of patients is different from the normal female.
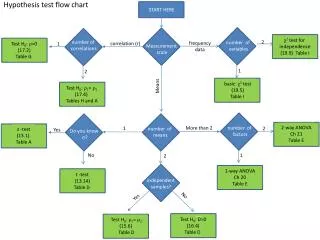
HYPOTHESIS TEST REGARDING MEANS • t test for One sample(example) • t test for two samples • Paired t test • 2 sample t test for Independent Samples
Example7.2(one side test) Sample: A random sample of 25 health men reside in mountainous area, the mean of their pulse (sphygmus) is 74.2 times/min, and sd 6.0 times/min。 Question: Can you conclude that the mean is significantly higher than 72 times /min (Which is the mean of pulse of normal men who reside in plain).
Ex. Cond. 1. State hypothesis: H0 : 1=72 The mean of pulse of healthy men who reside in mountainous area is same as the mean of healthy men who reside in plain H1 :1 > 72 The mean of pulse of healthy men who reside in mountainous area is larger than the mean of healthy men who reside in plain
Ex. Cond. • Predetermined =0.05(one side test)。
Ex. Cond. 3. Calculate test statistic: v=24
v=24 0 1.711 Ex. Cond. 4. P value: P=0.0396 P < 0.05 0.05
Ex. Cond. 5. Inference Reject H0,accept H1 at level =0.05。 The difference of two means is statistically significant. The mean of pulse of healthy men who reside in mountainous area is larger than the mean of healthy men who reside in plain.
Paired or matched dataExample7.3 Two equipments to test noise at same site and time
INFERENCES ON TWO POPULATIONS USING INDEPENDENT PAIRS OF CORRELATED DATA VALUES Paired Design(example of experiment)
Pairs • Two times of measurements of one individual • Two results of two types of test technique for one specimen • Studies with twins
Basic hypothesis • H0 : 1=2 or d=0 • That means two equipments have the same results for every measurements in a matched pair.
Solution To Example (1) H0 : d=0, the results are same. H1 : d≠0, the results are differ. (2) =0.05。 (3) Calculate t =9(t 0.05,9 = 2.262)。
Ex. Cond. (4) P value。 0.20 < P < 0.40。 (5) inference:have no evidence to reject H0 at level 0.05. (6) The test results of two equipments are the same.
Comparison between two means • Completely random design • 2 independent groups
Data structure 50 50