Download
1 / 6
60 likes | 160 Views
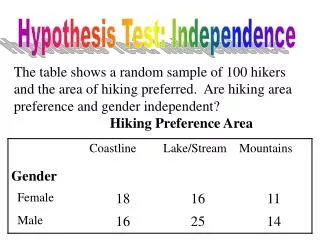
Perform a hypothesis test of independence to determine if gender and preferred hiking area are independent. The table presents data on 100 hikers and their hiking preferences, with observed and expected frequencies calculated. The Chi-Square test statistic is 1.4679, yielding a p-value of 0.4800. With a significance level of 0.05, the null hypothesis that gender and hiking area preference are independent is not rejected. Thus, it is concluded that there is independence between gender and hiking preferences.

E N D
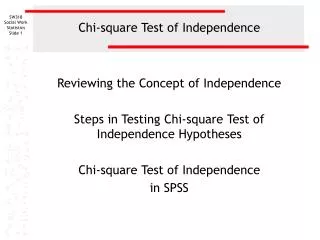
Hypothesis Test: Independence The table shows a random sample of 100 hikers and the area of hiking preferred. Are hiking area preference and gender independent? Hiking Preference Area
Hypothesis Test: Independence Ho: Gender and preferred hiking area are independent. Ha: Gender and preferred hiking area are not independent.
Hypothesis Test: Independence • The table contains the observed (O) frequencies. • If the null hypothesis is true, the expected percentages (E) are calculated by the formula • (row_total)(column_total) / total_surveyed • A Test of Independence is right-tailed. • The degrees of freedom (df) • = (# rows – 1)(# columns – 1) = (2 – 1)(3 – 1) = 2
Hypothesis Test: Independence Distribution for the Test: Chi-Square Mean of the distribution = number of dfs = 2
Hypothesis Test: Independence Test statistic: 1.4679 Measures how far the observed values are from the expected values. p-value: 0.4800
Hypothesis Test: Independence Decision: Assume α = 0.05 (α < p-value) DO NOT REJECT Ho. Conclusion: We conclude that gender and hiking preference are independent.