Hypothesis Testing and the T Test
Hypothesis Testing and the T Test. First: Lets Remember Z Scores. So: you received a 75 on a test. How did you do? If I said the mean was 72 what do you know? What if I said the standard deviation was 20? Or 10?. Z Scores . A Z score is just a metric to standardize any distribution

Hypothesis Testing and the T Test
E N D
Presentation Transcript
First: Lets Remember Z Scores • So: you received a 75 on a test. How did you do? • If I said the mean was 72 what do you know? • What if I said the standard deviation was 20? Or 10?
Z Scores • A Z score is just a metric to standardize any distribution • We don’t know what a 75 is without the mean and standard deviation. But if we knew the Z score is 1.5, we know exactly what that score means now.
Sampling (One Data Point) • Lets say we have a distribution with a mean of zero and std. dev. of 1. (That is, a Z distribution). • If you sample ONE item from this distribution, what is the probability that it came between -1 and 1? • More than 2?
Sampling Multiple Data Points • What if we drew two items from this distribution (with replacement) and then took the mean of those two items? • Three Items? • 1,000 Items?
Sampling From a Z Distribution • We call this the distribution of means • The variance of this distribution shrinks as the sample size goes up. • The variance of this new distribution is called the standard error. In this specific case it is the standard error of the mean.
Z Test • Basically, all statistical tests in the world look like this: • In this case, we want to know did a sample (that we observe) come from a population (that we have not observed). • We frame this question by saying “Is this sample mean significantly different from the population mean”
Z Test • M=Sample Mean • Population mean
What does this all mean? • So, say the Census Bureau says that the average age (mean) in the US is 31. • (With a standard deviation of 5) • I have sampled 20 people in my neighborhood and their average (mean) age is 33. • Is 33 a plausible average if my sample is typical of the US?
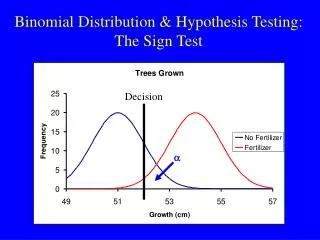
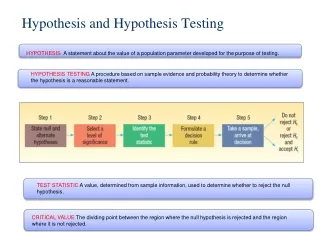
Hypothesis Tests • The Null Hypothesis: • This is the hypothesis that we are looking to disprove • Usually, that there is “No Difference” • i.e. My sample is the same as the population (in the Z test) • In statistics the Null Hypothesis takes the form of the distribution of results that we would expect by chance More Likely Outcomes Less Likely Outcomes
Hypothesis Tests • Remember, we have to take the upside down logic of how we would normally think about these things. • We say, if the null hypothesis were true, is my sample probable? More Likely Outcomes Less Likely Outcomes
T Test for Independent Samples • The question we are asking: • I have two samples: sample A and sample B measured on some continuous variable • Are these two samples from the same population? • Assumptions: • Independence (these are just random samples from a group) • These are drawn from normally distributed populations with the same standard deviation
T – Test: What We’re Asking • Do these samples come from the same population or different ones? • So: lets say they came from the same population- could we expect these samples by chance?
T Test (Independent Samples) • Usually, the formula looks like this:
More Hypothesis Testing • What is the problem with asking questions like this: “Do these samples probably come from the same population?” • Sometime we get unlikely results by chance • Or the opposite: sometimes by chance, different populations will produce similar samples
Type I Error • When we say that these two groups are probably from two different populations (but they are really from the same population) • Formally: “Incorrectly rejecting the null hypothesis” i.e. the null hypothesis is true • We set our probability of this error. It is called alpha. Generally we set it to .05.
Type II Error • This is when we say that two samples are from the same population, but they are really from different population • Formally, “Incorrectly accepting the null hypothesis, when the null hypothesis is false” • This error we do not set, it depends on the size of the effect you hope to detect. • Called Beta.