Gene Prediction: Statistical Approaches
540 likes | 674 Views
This overview delves into gene prediction methodologies, emphasizing the central dogma of molecular biology, which describes the process of DNA transcription to RNA and subsequent translation into proteins. It discusses key discoveries, including split genes and the significance of codons. Further, it explores challenges in computational gene prediction, particularly regarding the presence of introns in eukaryotic genes. The complexities of codon usage and the historical contributions of prominent scientists in the field are highlighted, showcasing the ongoing evolution of genetic research.

Gene Prediction: Statistical Approaches
E N D
Presentation Transcript
Outline • Central Dogma and Codons • Discovery of Split Genes • Splicing • Open Reading Frames • Codon Usage • Splicing Signals • TestCode
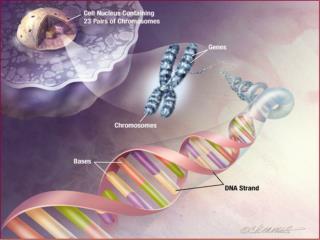
Gene Prediction: Computational Challenge • Gene: A sequence of nucleotides coding for a protein. • Gene Prediction Problem: Determine the beginning and end positions of genes in a genome.
DNA transcription RNA translation Protein Central Dogma: DNA -> RNA -> Protein CCTGAGCCAACTATTGATGAA CCUGAGCCAACUAUUGAUGAA PEPTIDE
Central Dogma: Doubts • Central Dogma was proposed in 1958 by Francis Crick. • However, he had very little evidence. • Before Crick’s seminal paper, all possible information transfers were considered viable. • Crick postulated that some of them are not viable. Pre-Crick Crick’s Proposal
Codons • 1961:Sydney Brenner and Francis Crick discover frameshift mutations: • These systematically delete nucleotides from DNA. • Single and double deletions dramatically alter protein product. • However, they noted that the effect of triple deletions was minor. • Conclusion: Every codon (triplet of nucleotides) codes for exactly one amino acid in a protein. Sydney Brenner Francis Crick
The Sly Fox • In the following string: THE SLY FOX AND THE SHY DOG • Delete 1, 2, and 3 nucleotides after the first ‘S’: • 1 Nucleotide: THE SYF OXA NDT HES HYD OG • 2 Nucleotides: THE SFO XAN DTH ESH YDO G • 3 Nucleotides: THE SOX AND THE SHY DOG • Which of the above makes the most sense? • This is the idea behind each codon coding one amino acids.
Translating Nucleotides into Amino Acids • There are 43 = 64 possible codons, since there are four choices for each of the three nucleotides in a codon. • Genetic code is degenerative and redundant. • Includes start and stop codons, whose only purpose is to represent the beginning or end of an important sequence. • Despite there being 64 codons, there are only 20 amino acids. • Therefore, an amino acid may be coded by more than one codon.
Great Discovery Provoking Wrong Assumption • 1964: Charles Yanofsky and SydneyBrenner prove collinearity in the order ofcodons with respect to amino acids in proteins. • 1967: Yanofsky and colleagues furtherprove that the sequence of codons in agene determines the sequence of aminoacids in a protein. • As a result, it was incorrectly assumed that the triplets encoding for amino acid sequences form contiguous strips of information. Charles Yanofsky
Discovery of Split Genes • 1977: Phillip Sharp and Richard Roberts experiment with mRNA of hexon, a viral protein. • They mapped hexon mRNA in viral genome by hybridization to adenovirus DNA and electron microscopy. • mRNA-DNA hybrids formed three curious loop structures instead of contiguous duplex segments. Phillip Sharp Richard Roberts
Discovery of Split Genes • 1977: “Adenovirus Amazes at Cold Spring Harbor” (Nature) documents "mosaic molecules consisting of sequences complementary to several non-contiguous segments of the viral genome.” • In other words, coding for a protein occurs at disjoint, nonconnected locations in the genome.
Exons and Introns • In eukaryotes, the gene is a combination of coding segments (exons) that are interrupted by non-coding segments (introns). • Prokaryotes don’t have introns—genes in prokaryotes are continuous. • Upshot: Introns make computational gene prediction in eukaryotes even more difficult. …AGGGTCTCATTGTAGACAGTGGTACTGATCAACGCAGGACTT… Non-coding Coding Non-coding Coding
aatgcatgcggctatgctaatgcatgcggctatgctaagctgggatccgatgacaatgcatgcggctatgctaatgcatgcggctatgcaagctgggatccgatgactatgctaagctgggatccgatgacaatgcatgcggctatgctaatgaatggtcttgggatttaccttggaatgctaagctgggatccgatgacaatgcatgcggctatgctaatgaatggtcttgggatttaccttggaatatgctaatgcatgcggctatgctaagctgggatccgatgacaatgcatgcggctatgctaatgcatgcggctatgcaagctgggatccgatgactatgctaagctgcggctatgctaatgcatgcggctatgctaagctgggatccgatgacaatgcatgcggctatgctaatgcatgcggctatgcaagctgggatcctgcggctatgctaatgaatggtcttgggatttaccttggaatgctaagctgggatccgatgacaatgcatgcggctatgctaatgaatggtcttgggatttaccttggaatatgctaatgcatgcggctatgctaagctgggaatgcatgcggctatgctaagctgggatccgatgacaatgcatgcggctatgctaatgcatgcggctatgcaagctgggatccgatgactatgctaagctgcggctatgctaatgcatgcggctatgctaagctcatgcggctatgctaagctgggaatgcatgcggctatgctaagctgggatccgatgacaatgcatgcggctatgctaatgcatgcggctatgcaagctgggatccgatgactatgctaagctgcggctatgctaatgcatgcggctatgctaagctcggctatgctaatgaatggtcttgggatttaccttggaatgctaagctgggatccgatgacaatgcatgcggctatgctaatgaatggtcttgggatttaccttggaatatgctaatgcatgcggctatgctaagctgggaatgcatgcggctatgctaagctgggatccgatgacaatgcatgcggctatgctaatgcatgcggctatgcaagctgggatccgatgactatgctaagctgcggctatgctaatgcatgcggctatgctaagctcatgcggaatgcatgcggctatgctaatgcatgcggctatgctaagctgggatccgatgacaatgcatgcggctatgctaatgcatgcggctatgcaagctgggatccgatgactatgctaagctgggatccgatgacaatgcatgcggctatgctaatgaatggtcttgggatttaccttggaatgctaagctgggatccgatgacaatgcatgcggctatgctaatgaatggtcttgggatttaccttggaatatgctaatgcatgcggctatgctaagctgggatccgatgacaatgcatgcggctatgctaatgcatgcggctatgcaagctgggatccgatgactatgctaagctgcggctatgctaatgcatgcggctatgctaagctgggatccgatgacaatgcatgcggctatgctaatgcatgcggctatgcaagctgggatcctgcggctatgctaatgaatggtcttgggatttaccttggaatgctaagctgggatccgatgacaatgcatgcggctatgctaatgaatggtcttgggatttaccttggaatatgctaatgcatgcggctatgctaagctgggaatgcatgcggctatgctaagctgggatccgatgacaatgcatgcggctatgctaatgcatgcggctatgcaagctgggatccgatgactatgctaagctgcggctatgctaatgcatgcggctatgctaagctcatgcggctatgctaagctgggaatgcatgcggctatgctaagctgggatccgatgacaatgcatgcggctatgctaatgcatgcggctatgcaagctgggatccgatgactatgctaagctgcggctatgctaatgcatgcggctatgctaagctcggctatgctaatgaatggtcttgggatttaccttggaatgctaagctgggatccgatgacaatgcatgcggctatgctaatgaatggtcttgggatttaccttggaatatgctaatgcatgcggctatgctaagctgggaatgcatgcggctatgctaagctgggatccgatgacaatgcatgcggctatgctaatgcatgcggctatgcaagctgggatccgatgactatgctaagctgcggctatgctaatgcatgcggctatgctaagctcatgcgg Gene Prediction: Computational Challenge
aatgcatgcggctatgctaatgcatgcggctatgctaagctgggatccgatgacaatgcatgcggctatgctaatgcatgcggctatgcaagctgggatccgatgactatgctaagctgggatccgatgacaatgcatgcggctatgctaatgaatggtcttgggatttaccttggaatgctaagctgggatccgatgacaatgcatgcggctatgctaatgaatggtcttgggatttaccttggaatatgctaatgcatgcggctatgctaagctgggatccgatgacaatgcatgcggctatgctaatgcatgcggctatgcaagctgggatccgatgactatgctaagctgcggctatgctaatgcatgcggctatgctaagctgggatccgatgacaatgcatgcggctatgctaatgcatgcggctatgcaagctgggatcctgcggctatgctaatgaatggtcttgggatttaccttggaatgctaagctgggatccgatgacaatgcatgcggctatgctaatgaatggtcttgggatttaccttggaatatgctaatgcatgcggctatgctaagctgggaatgcatgcggctatgctaagctgggatccgatgacaatgcatgcggctatgctaatgcatgcggctatgcaagctgggatccgatgactatgctaagctgcggctatgctaatgcatgcggctatgctaagctcatgcggctatgctaagctgggaatgcatgcggctatgctaagctgggatccgatgacaatgcatgcggctatgctaatgcatgcggctatgcaagctgggatccgatgactatgctaagctgcggctatgctaatgcatgcggctatgctaagctcggctatgctaatgaatggtcttgggatttaccttggaatgctaagctgggatccgatgacaatgcatgcggctatgctaatgaatggtcttgggatttaccttggaatatgctaatgcatgcggctatgctaagctgggaatgcatgcggctatgctaagctgggatccgatgacaatgcatgcggctatgctaatgcatgcggctatgcaagctgggatccgatgactatgctaagctgcggctatgctaatgcatgcggctatgctaagctcatgcggaatgcatgcggctatgctaatgcatgcggctatgctaagctgggatccgatgacaatgcatgcggctatgctaatgcatgcggctatgcaagctgggatccgatgactatgctaagctgggatccgatgacaatgcatgcggctatgctaatgaatggtcttgggatttaccttggaatgctaagctgggatccgatgacaatgcatgcggctatgctaatgaatggtcttgggatttaccttggaatatgctaatgcatgcggctatgctaagctgggatccgatgacaatgcatgcggctatgctaatgcatgcggctatgcaagctgggatccgatgactatgctaagctgcggctatgctaatgcatgcggctatgctaagctgggatccgatgacaatgcatgcggctatgctaatgcatgcggctatgcaagctgggatcctgcggctatgctaatgaatggtcttgggatttaccttggaatgctaagctgggatccgatgacaatgcatgcggctatgctaatgaatggtcttgggatttaccttggaatatgctaatgcatgcggctatgctaagctgggaatgcatgcggctatgctaagctgggatccgatgacaatgcatgcggctatgctaatgcatgcggctatgcaagctgggatccgatgactatgctaagctgcggctatgctaatgcatgcggctatgctaagctcatgcggctatgctaagctgggaatgcatgcggctatgctaagctgggatccgatgacaatgcatgcggctatgctaatgcatgcggctatgcaagctgggatccgatgactatgctaagctgcggctatgctaatgcatgcggctatgctaagctcggctatgctaatgaatggtcttgggatttaccttggaatgctaagctgggatccgatgacaatgcatgcggctatgctaatgaatggtcttgggatttaccttggaatatgctaatgcatgcggctatgctaagctgggaatgcatgcggctatgctaagctgggatccgatgacaatgcatgcggctatgctaatgcatgcggctatgcaagctgggatccgatgactatgctaagctgcggctatgctaatgcatgcggctatgctaagctcatgcgg Gene Prediction: Computational Challenge
aatgcatgcggctatgctaatgcatgcggctatgctaagctgggatccgatgacaatgcatgcggctatgctaatgcatgcggctatgcaagctgggatccgatgactatgctaagctgggatccgatgacaatgcatgcggctatgctaatgaatggtcttgggatttaccttggaatgctaagctgggatccgatgacaatgcatgcggctatgctaatgaatggtcttgggatttaccttggaatatgctaatgcatgcggctatgctaagctgggatccgatgacaatgcatgcggctatgctaatgcatgcggctatgcaagctgggatccgatgactatgctaagctgcggctatgctaatgcatgcggctatgctaagctgggatccgatgacaatgcatgcggctatgctaatgcatgcggctatgcaagctgggatcctgcggctatgctaatgaatggtcttgggatttaccttggaatgctaagctgggatccgatgacaatgcatgcggctatgctaatgaatggtcttgggatttaccttggaatatgctaatgcatgcggctatgctaagctgggaatgcatgcggctatgctaagctgggatccgatgacaatgcatgcggctatgctaatgcatgcggctatgcaagctgggatccgatgactatgctaagctgcggctatgctaatgcatgcggctatgctaagctcatgcggctatgctaagctgggaatgcatgcggctatgctaagctgggatccgatgacaatgcatgcggctatgctaatgcatgcggctatgcaagctgggatccgatgactatgctaagctgcggctatgctaatgcatgcggctatgctaagctcggctatgctaatgaatggtcttgggatttaccttggaatgctaagctgggatccgatgacaatgcatgcggctatgctaatgaatggtcttgggatttaccttggaatatgctaatgcatgcggctatgctaagctgggaatgcatgcggctatgctaagctgggatccgatgacaatgcatgcggctatgctaatgcatgcggctatgcaagctgggatccgatgactatgctaagctgcggctatgctaatgcatgcggctatgctaagctcatgcggaatgcatgcggctatgctaatgcatgcggctatgctaagctgggatccgatgacaatgcatgcggctatgctaatgcatgcggctatgcaagctgggatccgatgactatgctaagctgggatccgatgacaatgcatgcggctatgctaatgaatggtcttgggatttaccttggaatgctaagctgggatccgatgacaatgcatgcggctatgctaatgaatggtcttgggatttaccttggaatatgctaatgcatgcggctatgctaagctgggatccgatgacaatgcatgcggctatgctaatgcatgcggctatgcaagctgggatccgatgactatgctaagctgcggctatgctaatgcatgcggctatgctaagctgggatccgatgacaatgcatgcggctatgctaatgcatgcggctatgcaagctgggatcctgcggctatgctaatgaatggtcttgggatttaccttggaatgctaagctgggatccgatgacaatgcatgcggctatgctaatgaatggtcttgggatttaccttggaatatgctaatgcatgcggctatgctaagctgggaatgcatgcggctatgctaagctgggatccgatgacaatgcatgcggctatgctaatgcatgcggctatgcaagctgggatccgatgactatgctaagctgcggctatgctaatgcatgcggctatgctaagctcatgcggctatgctaagctgggaatgcatgcggctatgctaagctgggatccgatgacaatgcatgcggctatgctaatgcatgcggctatgcaagctgggatccgatgactatgctaagctgcggctatgctaatgcatgcggctatgctaagctcggctatgctaatgaatggtcttgggatttaccttggaatgctaagctgggatccgatgacaatgcatgcggctatgctaatgaatggtcttgggatttaccttggaatatgctaatgcatgcggctatgctaagctgggaatgcatgcggctatgctaagctgggatccgatgacaatgcatgcggctatgctaatgcatgcggctatgcaagctgggatccgatgactatgctaagctgcggctatgctaatgcatgcggctatgctaagctcatgcgg Gene Prediction: Computational Challenge Gene!
Central Dogma and Splicing intron1 intron2 exon2 exon3 exon1 transcription splicing translation Batzoglou
Splicing Signals • Exons are interspersed with introns and typically flanked by splicing signals: GT and AG. • Splicing signals can be helpful in identifying exons. • Issue: GT and AG occur so often that it is almost impossible to determine when they occur as splicing signals and when they don’t.
Promoters • Promoters are DNA segments upstream of transcripts that initiate transcription. • A promoter attracts RNA Polymerase to the transcription start site. 5’ 3’ Promoter
Splicing Mechanism Adenine recognition site marks intron. From lectures by Chris Burge (MIT)
Splicing Mechanism • Adenine recognition site marks intron. • snRNPs bind around adenine recognition site. From lectures by Chris Burge (MIT)
Splicing Mechanism Adenine recognition site marks intron. snRNPs bind around adenine recognition site. The spliceosome thus forms and excises introns in the mRNA. From lectures by Chris Burge (MIT)
Splicing Mechanism Adenine recognition site marks intron. snRNPs bind around adenine recognition site. The spliceosome thus forms and excises introns in the mRNA. From lectures by Chris Burge (MIT)
Two Approaches to Gene Prediction • Statistical: Exons have typical sequences on either end and use different subwords than introns. • Therefore, we can run statistical analysis on the subwords of a sequence to locate potential exons. • Similarity-based: Many human genes are similar to genes in mice, chicken, or even bacteria. • Therefore, already known mouse, chicken, and bacterial genes may help to find human genes.
Statistical Approach: Metaphor • Noting the differing frequencies of symbols (e.g. ‘%’, ‘.’, ‘-’) and numerical symbols could you distinguish between a story and the stock report in a foreign newspaper?
Similarity-Based Approach: Metaphor • If you could compare the day’s news in English, side-by-side to the same news in a foreign language, some similarities may become apparent.
Genetic Code and Stop Codons • UAA, UAG and UGA correspond to 3 Stop codons that (together with Start codon ATG) delineate Open Reading Frames.
Stop and Start Codons • Codons often appear exclusively to start/stop transcription: • Start Codon: ATG • Stop Codons: TAA, TAG, TGA
Open Reading Frames (ORFs) • Detect potential coding regions by looking at Open Reading Frames (ORFs): • A genome of length n is comprised of (n/3) codons. • Stop codons break genome into segments between consecutive stop codons. • The subsegments of these segments that start from the Start codon (ATG) are ORFs. • ORFs in different frames may overlap. ATG TGA Genomic Sequence Open reading frame
6 Possible Frames for ORFs • There are six total frames in which to find ORFs: • Three possible ways of splitting the sequence into codons. • We can “read” a DNA sequence either forward or backward. • Illustration: CTGCAGACGAAACCTCTTGATGTAGTTGGCCTGACACCGACAATAATGAAGACTACCGTCTTACTAACAC CTGCAGACGAAACCTCTTGATGTAGTTGGCCTGACACCGACAATAATGAAGACTACCGTCTTACTAACAC CTGCAGACGAAACCTCTTGATGTAGTTGGCCTGACACCGACAATAATGAAGACTACCGTCTTACTAACAC CTGCAGACGAAACCTCTTGATGTAGTTGGCCTGACACCGACAATAATGAAGACTACCGTCTTACTAACAC GACGTCTGCTTTGGAGAACTACATCAACCGGACTGTGGCTGTTATTACTTCTGATGGCAGAATGATTGTG GACGTCTGCTTTGGAGAACTACATCAACCGGACTGTGGCTGTTATTACTTCTGATGGCAGAATGATTGTG GACGTCTGCTTTGGAGAACTACATCAACCGGACTGTGGCTGTTATTACTTCTGATGGCAGAATGATTGTG GACGTCTGCTTTGGAGAACTACATCAACCGGACTGTGGCTGTTATTACTTCTGATGGCAGAATGATTGTG
6 Possible Frames for ORFs • There are six total frames in which to find ORFs: • Three possible ways of splitting the sequence into codons. • We can “read” a DNA sequence either forward or backward. • Illustration: CTGCAGACGAAACCTCTTGATGTAGTTGGCCTGACACCGACAATAATGAAGACTACCGTCTTACTAACAC CTGCAGACGAAACCTCTTGATGTAGTTGGCCTGACACCGACAATAATGAAGACTACCGTCTTACTAACAC CTGCAGACGAAACCTCTTGATGTAGTTGGCCTGACACCGACAATAATGAAGACTACCGTCTTACTAACAC CTGCAGACGAAACCTCTTGATGTAGTTGGCCTGACACCGACAATAATGAAGACTACCGTCTTACTAACAC GACGTCTGCTTTGGAGAACTACATCAACCGGACTGTGGCTGTTATTACTTCTGATGGCAGAATGATTGTG GACGTCTGCTTTGGAGAACTACATCAACCGGACTGTGGCTGTTATTACTTCTGATGGCAGAATGATTGTG GACGTCTGCTTTGGAGAACTACATCAACCGGACTGTGGCTGTTATTACTTCTGATGGCAGAATGATTGTG GACGTCTGCTTTGGAGAACTACATCAACCGGACTGTGGCTGTTATTACTTCTGATGGCAGAATGATTGTG
6 Possible Frames for ORFs • There are six total frames in which to find ORFs: • Three possible ways of splitting the sequence into codons. • We can “read” a DNA sequence either forward or backward. • Illustration: CTGCAGACGAAACCTCTTGATGTAGTTGGCCTGACACCGACAATAATGAAGACTACCGTCTTACTAACAC CTGCAGACGAAACCTCTTGATGTAGTTGGCCTGACACCGACAATAATGAAGACTACCGTCTTACTAACAC CTGCAGACGAAACCTCTTGATGTAGTTGGCCTGACACCGACAATAATGAAGACTACCGTCTTACTAACAC CTGCAGACGAAACCTCTTGATGTAGTTGGCCTGACACCGACAATAATGAAGACTACCGTCTTACTAACAC GACGTCTGCTTTGGAGAACTACATCAACCGGACTGTGGCTGTTATTACTTCTGATGGCAGAATGATTGTG GACGTCTGCTTTGGAGAACTACATCAACCGGACTGTGGCTGTTATTACTTCTGATGGCAGAATGATTGTG GACGTCTGCTTTGGAGAACTACATCAACCGGACTGTGGCTGTTATTACTTCTGATGGCAGAATGATTGTG GACGTCTGCTTTGGAGAACTACATCAACCGGACTGTGGCTGTTATTACTTCTGATGGCAGAATGATTGTG
Long vs. Short ORFs • At random, we should expect one stop codon every (64/3) ~= 21 codons. • However, genes are usually much longer than this. • An intuitive approach to gene prediction is to scan for ORFs whose length exceeds a certain threshold value. • Issue: This method is naïve because some genes (e.g. some neural and immune system genes) are not long enough to be detected.
Testing ORFs: Codon Usage • Idea: Amino acids typically are coded by more than one codon, but in nature certain codons occur more commonly. • Therefore, uneven codon occurrence may characterize a real gene. • Solution: Create a 64-element hash table and count the frequencies of codons in an ORF. • This compensates for pitfalls of the ORF length test.
Codon Occurrence in Mouse Genome AA codon /1000 frac Ser TCG 4.31 0.05 Ser TCA 11.44 0.14 Ser TCT 15.70 0.19 Ser TCC 17.92 0.22 Ser AGT 12.25 0.15 Ser AGC 19.54 0.24 Pro CCG 6.33 0.11 Pro CCA 17.10 0.28 Pro CCT 18.31 0.30 Pro CCC 18.42 0.31 AA codon /1000 frac Leu CTG 39.95 0.40 Leu CTA 7.89 0.08 Leu CTT 12.97 0.13 Leu CTC 20.04 0.20 Ala GCG 6.72 0.10 Ala GCA 15.80 0.23 Ala GCT 20.12 0.29 Ala GCC 26.51 0.38 Gln CAG 34.18 0.75 Gln CAA 11.51 0.25
How to Find Best ORFs • An ORF is more “believable” than another if it has more “likely” codons. • Do sliding window calculations to find best ORFs. • Allows for higher precision in identifying true ORFs; much better than merely testing for length. • However, average vertebrate exon length is 130 nucleotides, which is often too small to produce reliable peaks in the likelihood ratio. • Further improvement: In-frame hexamer count (examines frequencies of pairs of consecutive codons).
Splicing Signals • Try to recognize location of splicing signals at exon-intron junctions, which are simply small subsequence of DNA that indicate potential transcription.. • This method has yielded a weakly conserved donor splice site and acceptor splice site. • Unfortunately, profiles for such sites are still weak, and lends the problem to the Hidden Markov Model (HMM) approaches, which capture the statistical dependencies between sites.
Donor and Acceptor Sites: GT and AG • The beginning and end of exons are signaled by donor and acceptor sites that usually have GT and AC dinucleotides. • Detecting these sites is difficult, because GT and AC appear very often without indicating splicing. Donor Site Acceptor Site GT AC exon 1 exon 2
Donor and Acceptor Sites: Motif Logos Donor: 7.9 bits Acceptor: 9.4 bits (Stephens & Schneider, 1996) (http://www-lmmb.ncifcrf.gov/~toms/sequencelogo.html)
Gene Prediction and Motifs • Upstream regions of genes often contain motifs. • These motifs can be used to supplement the method of splicing signals. • Illustration: ATG STOP -35 -10 0 10 TTCCAA TATACT Pribnow Box GGAGG Ribosomal binding site Transcription start site
TestCode • 1982: James Fickett develops TestCode. • Idea: There is a tendency for nucleotides in coding regions to be repeated with periodicity of 3. • TestCode judges randomness instead of codon frequency. • Finds “putative” coding regions, not introns, exons, or splice sites. James Fickett
TestCode Statistics • Define a window size no less than 200 bp, and slide the window the sequence down 3 bases at a time. • In each window: • Calculate the following formula for each base {A, T, G, C}: • Use these values to obtain a probability from a lookup table (which was previously defined and determined experimentally with known coding and noncoding sequences).