Chapter 1 Why Study Statistics?
EF 507 QUANTITATIVE METHODS FOR ECONOMICS AND FINANCE FALL 2008. Chapter 1 Why Study Statistics?. Chapter Goals. After completing this chapter, you should be able to: Explain how decisions are often based on incomplete information Explain key definitions: Population vs. Sample

Chapter 1 Why Study Statistics?
E N D
Presentation Transcript
EF 507 QUANTITATIVE METHODS FOR ECONOMICS AND FINANCE FALL 2008 Chapter 1Why Study Statistics?
Chapter Goals After completing this chapter, you should be able to: • Explain how decisions are often based on incomplete information • Explain key definitions: Population vs. Sample Parameter vs. Statistic Descriptive vs. Inferential Statistics • Describe random sampling • Explain the difference between Descriptive and Inferential statistics
Dealing with Uncertainty Everyday decisions are based on incomplete information Consider: • The price of IBM stock will be higher in six months than it is now. • If the budget deficit is as high as predicted, interest rates will remain high for the rest of the year.
Dealing with Uncertainty (continued) Because of uncertainty, the statements should be modified: • The price of IBM stock is likely to be higher in six months than it is now. • If the budget deficit is as high as predicted, it is probable that interest rates will remain high for the rest of the year.
Key Definitions • A population is the collection of all items of interest or under investigation • N represents the population size • A sample is an observed subset of the population • n represents the sample size • A parameter is a specific characteristic of a population • A statistic is a specific characteristic of a sample
Population vs. Sample Population Sample a b c d ef gh i jk l m n o p q rs t u v w x y z b c g i n o r u y Values calculated using population data are called parameters Values computed from sample data are called statistics
Examples of Populations • Names of all registered voters in Istanbul • Annual returns of all stocks traded on the IMKB • Grade point averages of all the students in your university
Random Sampling Simple random sampling is a procedure in which • each member of the population is chosen strictly by chance, • each member of the population is equally likely to be chosen, and • every possible sample of n objects is equally likely to be chosen The resulting sample is called a random sample
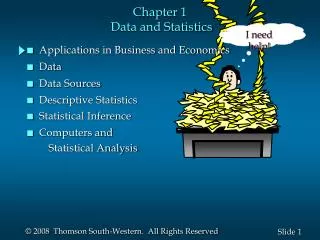
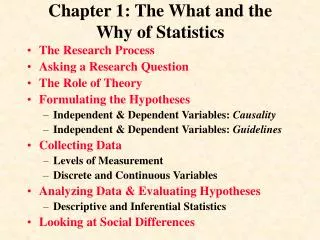
Descriptive and Inferential Statistics Two branches of statistics: • Descriptive statistics • Collecting, summarizing, and processing data to transform data into information • Inferential statistics • provide the bases for predictions, forecasts, and estimates that are used to transform information into knowledge
Descriptive Statistics • Collect data • e.g., Survey • Present data • e.g., Tables and graphs • Summarize data • e.g., Sample mean =
Inferential Statistics • Estimation • e.g., Estimate the population mean weight using the sample mean weight • Hypothesis testing • e.g., Test the claim that the population mean weight is 75 kg Inference is the process of drawing conclusions or making decisions about a populationbased on sample results
The Decision Making Process Decision Knowledge Experience, Theory, Literature, Inferential Statistics, Computers Information Descriptive Statistics, Probability, Computers Begin Here: Identify the Problem Data
Chapter Summary • Reviewed incomplete information in decision making • Introduced key definitions: • Population vs. Sample • Parameter vs. Statistic • Descriptive vs. Inferential statistics • Described random sampling • Examined the decision making process
A company has developed a new battery, but the average lifetime is unknown. In order to estimate this average, a sample of 100 batteries is tested and the average lifetime of this sample is found to be 250 hours. The 250 hours is the value of: a) a parameter. b) a statistic. c) a sampling frame. d) a population.
A summary measure that is computed from a population is called a) a parameter b) a statistic c) a population d) inferential statistics
An office supply warehouse has boxes of pencils, 100 pencils to the box. Information about the entire warehouse as well as a sample of the boxes is shown below: • Describe the population. • ANSWER: All boxes of pencils in the warehouse • What is the population size? • ANSWER: 1875 boxes • Describe the sample. • ANSWER: The boxes of pencils sampled. • What is the sample size? • ANSWER: 77 boxes