Thematic Maps
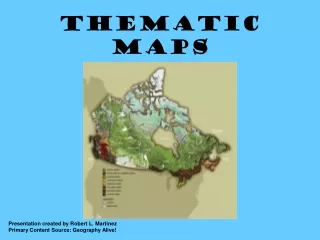
Thematic Maps. Presentation created by Robert L. Martinez Primary Content Source: Geography Alive!. Thematic maps are all around us. Tune in to a news program and you’re likely to see a weather map with high and low temperatures for towns in your area.

Thematic Maps
E N D
Presentation Transcript
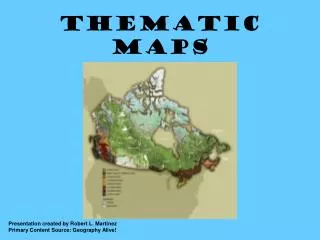
Thematic Maps Presentation created by Robert L. Martinez Primary Content Source: Geography Alive!
Thematic maps are all around us. Tune in to a news program and you’re likely to see a weather map with high and low temperatures for towns in your area.
To find your way on the local bus system, you might use a map showing bus routes.
By focusing on a specific topic, or theme, maps like these show information about some aspect of physical or human geography.
Some thematic maps focus on physical geography. For instance, they may display Earth’s physical features, the natural parts of Earth’s surface.
Such features include landforms like mountains, valleys, plains, and plateaus.
Physical features also include bodies of water such as oceans, seas, rivers, and lakes.
Thematic maps can also illustrate other aspects of the physical environment. For example, some maps focus on climate, or long-term weather patterns.
Climate maps show how much rainfall different areas receive.
They also show how hot or cold various places tend to be in winter and summer.
Climate has a tremendous effect on the types of vegetation, or trees and other plants, that will grow in an area.
You can see this by comparing a climate map of Earth with a vegetation map.
A vegetation map shows the kinds of trees and other plants that grow in various places.
In many ways it looks like a climate map, although other factors also affect what will grow where.
Thematic maps can also focus on human geography. An example is a political map.
Political maps of larger areas show the borders between countries.
Political maps also show important cities, such as the capitals of states and countries.
Another type of thematic map shows population density. This is the average number of people living in a unit of area, such as a square mile.
The higher the number the more crowded an area is. A population density map reveals where large numbers of people cluster.
Besides showing where people live, a thematic map can show what they do. A map of economic activity focuses on the ways people produce, buy, and sell goods and services.
This kind of map might show the main types of business and industry in an area. It might also show the natural resources that fuel the area’s economy.
Natural resources are useful items found in nature, such as wood, coal, and oil.
To read a thematic map, first look at a map’s title. The title usually states the topic of the map.
Then look at the map legend to determine how to read the map’s symbols.
A map legend may also explain how the map uses colors. For instance, a thematic map might use colors to show differences in elevation or population density.