Download
1 / 24
240 likes | 483 Views
The Science of Prediction. Monitoring Volcanic Activity. Signs of Volcanic Activity. Scientists look for five signs that volcanic processes are at work Eruption History Volcanic Gases Heat and Hydrothermal Activity Earthquakes Ground deformation. Monitoring.

E N D
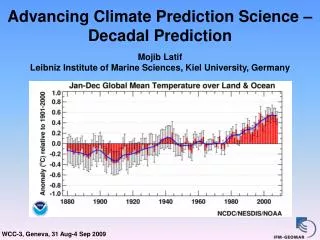
The Science of Prediction Monitoring Volcanic Activity Promoting Earth science by advancing high-precision techniques to measure deformation.
Signs of Volcanic Activity • Scientists look for five signs that volcanic processes are at work • Eruption History • Volcanic Gases • Heat and Hydrothermal Activity • Earthquakes • Ground deformation
Monitoring • Scientists use many types of tools to monitor volcanoes for signs of volcanic activity • Since erupting volcanoes are dangerous, scientists prefer tools that can be set up on a volcano and then left alone to do it’s job Image from USGS (2002) Volcano Hazards Program: Strategy for reducing volcanic riskhttp://volcanoes.usgs.gov/
Monitoring • These tools usually use radio signals to transmit data to a field office or “Volcano Observatory” • There are five volcano observatories in the US operated by partnerships between the USGS and other organizations • Alaska (AVO) • Hawaii (HVO) • Cascades WA (CVO) • Long Valley CA (LVO) • Yellowstone MT (YVO)
Monitoring • Mt. St. Helens in Washington state erupted May 18th 1980 • Scientists were able to save many lives by closely monitoring the warning signs that predicted an upcoming eruption • By April 1980, Mt. St. Helens was covered with monitoring equipment Image from Smithsonian National Museum of Natural History (n.d.) Global Volcanism Program: St. Helens Index of Monthly Reports http://www.volcano.si.edu/world/volcano.cfm?vnum=1201-05-&volpage=var#sean_0509
Eruptions • “The Past is the Key to the Present” Scientists can learn a lot about how a volcano erupts by looking at it’s past eruptions • Ash, gas and steam eruptions • Occur when hot, pressurized, trapped gases or steam escape • Usually detected by surface earthquakes, elevated volcanic gas levels and visual plumes • Before erupting May 1980, Mt. St. Helens had many gas and steam eruptions • Since 1980, Mt. St. Helens has continued to have periodic steam eruptions Image from Haselhorst, C (1980) Yellowstone Digital Slide File “Volcanics, Igneous” http://www.nps.gov/archive/yell/slidefile/geology/volcanicsigneous/Page-4.htm
Eruptions • Lava flows • Occur when magma rises to the surface and “leaks” out of cracks/fissures or vents • Usually detected by shallow earthquakes followed by elevated gas levels and heat measurements • In September 2004 Mt. St. Helens began erupting lava into its crater slowly building a dome Image from Yellowstone Digital Slide File “Volcanics, Igneous” http://www.nps.gov/archive/yell/slidefile/geology/volcanicsigneous/Page-8.htm
Eruptions • Pyroclastic flows • Occur when superheated gases “flow” down the flanks of a volcano • Can be preceded by earthquakes and elevated gas levels however Mt. St. Helens’ pyroclastic flow was initiated by a landslide • On May 18th 1980, Mt. St. Helens devastated the local ecology when a pyroclastic flow descended the north flank, destroying everything in its path • Hydrothermal explosions • Occur when superheated, pressurized and trapped steam escapes blowing a crater in the ground • May happen even when magma is not rising Image from Yellowstone Digital Slide File “Volcanics, Igneous” http://www.nps.gov/archive/yell/slidefile/geology/volcanicsigneous/Page-3.htm
Volcanic Gases • Gases dissolved in magma provide the energy for volcanic eruptions • Volcanic gases are the result of chemical reactions and physical changes in the magma as it rises and cools • Gases can be released as magma rises, as it erupts to the surface and even as magma cools below the surface • THE PRIMARY GAS IN AN ERUPTION IS WATER VAPOR! Image from Driedger, C., Doherty, A., and Dixon, C. (Project Coordinators), 2005, Living with a Volcano in your Backyard -- An Educator's Guide with Emphasis on Mount Rainier: U.S. Geological Survey and National Park Service, General Interest Publication 19. http://vulcan.wr.usgs.gov/Outreach/Publications/GIP19/framework.html
Volcanic Gases • Volcanic gases often get trapped underground where pressure builds up causing pyroclastic, steam or ash eruptions or hydrothermal explosions • Monitored gases include • Carbon dioxide • Sulfur dioxide • Hydrogen sulfide Post 1980 Steam plume from Mt. St. Helens Image by S.R. Brantley accessed from USGS Volcano Hazards Program “Measuring volcanic gases: emission rates of sulfur dioxide and carbon dioxide in volcanic plumes.” http://volcanoes.usgs.gov/About/What/Monitor/Gas/plumes.html
Volcanic Gases • Volcanic gases are hard to sample and measure because they are found in hazardous places and are toxic to living things • Volcanic gases are detected using • Spectrometers on the ground or mounted on an airplane • By collecting samples by hand and analyzing them in a laboratory A scientist collects gas samples for analysis. Notice the protective equipment that he is wearing. Image from USGS Volcano Hazards Program “Measuring volcanic gases: emission rates of sulfur dioxide and carbon dioxide in volcanic plumes.” http://volcanoes.usgs.gov/About/What/Monitor/Gas/plumes.html
Volcanic Gases • Emissions of gases can also be detected by noticing their effect on living things such as trees and animals • These trees on Mammoth Mountain in CA died from carbon dioxide Image from USGS Fact Sheet 172-96 “Invisible CO2 Gas Killing Trees at Mammoth Mountain, California” http://pubs.usgs.gov/fs/fs172-96/
Volcanic Gases • Following Mt. St. Helen’s eruption in 1980, Sulfur dioxide levels fell dramatically • Notice that the vertical scale is in TONS per DAY! • AFTER the May 18th eruption, Mt. St. Helens still released nearly 500,000 metric tons of sulfur dioxide gas into the atmosphere Image from USGS (2002) Volcano Hazards Program: Strategy for reducing volcanic risk “SO2 gas emission rates of Mount St. Helens, 1980-1988 http://volcanoes.usgs.gov/About/What/Monitor/Gas/MSH1980-88.html
Heat and Hydrothermal Activity • Water from precipitation and snow- melt seeps into the ground by following fractures and cracks in the bedrock. • This water is then warmed by heat (800 degrees C or more) from the magma chamber or hot rock causing it to rise back to the surface. • As heated water rises, the pressure from rocks above decreases and the liquid expands. • If this expanded water gets trapped then it becomes pressurized by gases and may lead to geysers, steam eruptions or hydrothermal explosions. • If the gas is allowed to escape then the heated water bubbles to the surface as a hot spring or bubbling mudpot 1 4 5 3 2 Image from Clynne, M., Janik, C., and Muffler, L. (n.d.) “Hot Water” in Lassen Volcanic National Park— Fumaroles, Steaming Ground, and Boiling Mudpots.” USGS Fact Sheet 101-02 pubs.usgs.gov/fs/2002/fs101-02/
Heat and Hydrothermal Activity • Hydrothermal Activity results from a magmatic heat source, so it demonstrates the presence of magma, not necessarily that the magma is moving to the surface • Thermal features can be monitored by • Night time aerial observations • FLIR (Forward Looking Infrared) thermal imaging which takes photographs of features in infrared wavelengths of light • Direct temperature measurements FLIR image of Mt. St. Helens’ new dome June 26th 2007 Image from (2007) USGS Mount St. Helens, Washington Forward Looking Infrared Images http://vulcan.wr.usgs.gov/Imgs/Jpg/MSH/MSH07/MSH07_area_new_growth_on_dome_06-26-07_FLIR_med.jpg
Earthquakes • Moving magma and volcanic fluids cause earthquakes • Earthquakes always increase before an eruption because liquid magma, hot fluids, and gases are less dense than the surrounding rocks so they must move through the crust to reach the surface. • Most volcanic earthquakes are less than a 2 or 3 magnitude, are less than 10 km deep and occur in swarms of many earthquakes Image from USGS Volcano Hazards Program “Monitoring Volcano Seismicity.” http://volcanoes.usgs.gov/About/What/Monitor/Seis/SeisMonitor.html Magma rises into reservoir beneath volcano Rising magma and volcanic gases exert pressure High pressure causes rocks to break, triggering earthquakes
Earthquakes • Earthquakes are measured by seismometers that detect ground vibrations • Different sources of vibrations cause different patterns on a seismometer • Scientists can detect magma on the move by looking for the pattern of magmatic earthquakes called volcanic tremors (VT’s) Image from USGS Volcano Hazards Program “Monitoring Volcano Seismicity.” http://volcanoes.usgs.gov/About/What/Monitor/Seis/SeisMonitor.html Seismographs record seismic signatures, Mount Pinatubo, Philippines
Earthquakes • Scientists can tell where Mt. St. Helens’ magma source is by looking at it’s pattern of earthquakes
Earthquakes • Between March 1980 and May 1980 an average of 10 magnitude >3.5 earthquakes were recorded per day at Mt. St. Helens • Swarms of hundreds of smaller earthquakes occurred daily • Earthquakes continue to be common at Mt. St. Helens since dome rebuilding began in 2004 Image from Smithsonian National Museum of Natural History (n.d.) Global Volcanism Program: St. Helens Index of Monthly Reports http://www.volcano.si.edu/world/volcano.cfm?vnum=1201-05-&volpage=var#sean_0509
Ground Deformation • Volcanoes change shape before, during, and after eruptions by inflating (bulging) or deflating (sinking) • Deformation is caused by huge regions of trapped and pressurized gases or fluids that can be detected by monitoring gas emissions • Deformation can also be a sign of rising magma that is usually accompanied by swarms of shallow earthquakes Upward pressure from rising magma deforms volcano Illustration byB. Myers and S. Brantley Image from USGS Volcano Hazards Program “Monitoring Volcano Seismicity.” http://volcanoes.usgs.gov/About/What/Monitor/Seis/SeisMonitor.html
Ground Deformation Tiltmeter site on crater floor of Mount St. Helens Photograph by S.R. Brantley on 9 June 1982 • Deformation is measured using • Tiltmeters which work like a carpenter’s level and can be left in place • Global Positioning System which uses satellites to triangulate the position of a GPS receiver unit • Leveling Survey where scientists use survey equipment to measure position and then return periodically to make additional measurements GPS site on Augustine Volcano, Alaska Image from USGS Volcano Hazards Program “Monitoring Volcano Ground Deformation.” http://volcanoes.usgs.gov/About/What/Monitor/Deformation/GrndDefrm.html
Ground Deformation • Between March 1980 and May 1980, Mt. St. Helens’ north flank bulged up to 60 meters • This deformation lead to the huge landslide that induced the pyroclastic flow, volcanic mudflow and ash eruption on May 18th 1980 Image from Smithsonian National Museum of Natural History (n.d.) Global Volcanism Program: St. Helens Index of Monthly Reports http://www.volcano.si.edu/world/volcano.cfm?vnum=1201-05-&volpage=var#sean_0509
The Science of Prediction • Even though scientists could not predict the exact moment when Mt. St. Helens would erupt, they were able to save many lives by predicting that it would erupt. Table 1. SUMMARY OF VOLCANIC- ALERT LEVELS NORMALTypical background activity of a volcano in a non- eruptive state After a change from a higher level: Volcanic activity considered to have ceased, and volcano reverted to its normal, non- eruptive state. ADVISORY Elevated unrest above known background activity After a change from a higher level: Volcanic activity has decreased significantly but continues to be closely monitored for possible renewed increase. WATCHHeightened/escalating unrest with increased potential for eruptive activity (timeframe variable) OR a minor eruption underway that poses limited hazards WARNING Highly hazardous eruption underway or imminent Table from USGS Volcano Hazards Program “USGS Volcano-Warning Scheme for the United States” http://volcanoes.usgs.gov/Products/Warn/WarnSchemes.html
Sources • Driedger, C., Doherty, A., and Dixon, C. (Project Coordinators), (2005), “Living with a Volcano in your Backyard -- An Educator's Guide with Emphasis on Mount Rainier”. U.S. Geological Survey and National Park Service, General Interest Publication 19. http://vulcan.wr.usgs.gov/Outreach/Publications/GIP19/framework.html • Smithsonian National Museum of Natural History (n.d.) Global Volcanism Program: St. Helens Index of Monthly Reports http://www.volcano.si.edu/world/volcano.cfm?vnum=1201-05-&volpage=var#sean_0509 • USGS (2007) Volcano and Hydrologic Monitoring Techniques http://vulcan.wr.usgs.gov/Monitoring/techniques.html#seismic_monitoring • USGS (2002) Volcano Hazards Program: Strategy for reducing volcanic riskhttp://volcanoes.usgs.gov/