Analysis of Gene Expression in EWS Cell Lines After 5-Aza Treatment
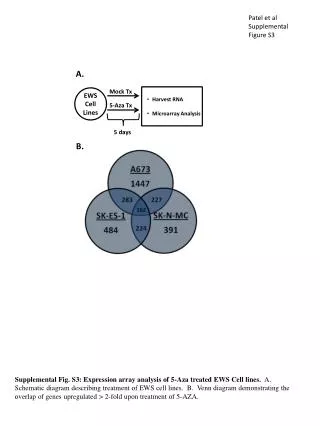
This study focuses on the effects of 5-Aza treatment on Ewing Sarcoma (EWS) cell lines. Supplemental Figure S3 provides a comprehensive overview of the experimental methodology, including a schematic diagram explaining the treatment of EWS cell lines and a Venn diagram illustrating the genes that are significantly upregulated (greater than 2-fold) post-treatment. The microarray analysis delineates the gene expression changes induced by 5-Aza, contributing valuable insights into the molecular mechanisms underlying EWS and potential therapeutic strategies.

Analysis of Gene Expression in EWS Cell Lines After 5-Aza Treatment
E N D
Presentation Transcript
Patel et al Supplemental Figure S3 A. Mock Tx • Harvest RNA • Microarray Analysis EWS Cell Lines 5-Aza Tx 5 days B. Supplemental Fig. S3: Expression array analysis of 5-Aza treated EWS Cell lines. A. Schematic diagram describing treatment of EWS cell lines. B. Venn diagram demonstrating the overlap of genes upregulated > 2-fold upon treatment of 5-AZA.