Download
1 / 31
310 likes | 406 Views
Review of normal distribution, sampling distributions, Central Limit Theorem, and confidence intervals for population parameters calculation.

E N D
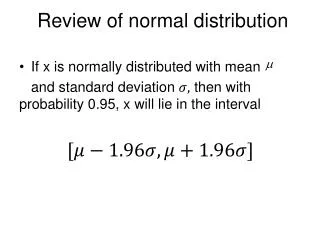
Review of normal distribution • If x is normally distributed with mean and standard deviation then with probability 0.95, x will lie in the interval
Exercise Assume x is normal distributed with mean and standard deviation Find an interval in which x is guaranteed to lie with probability 0.90.
Solution Assume x is normal distributed with meanand standard deviation Find an interval in which x is guaranteed to lie with probability 0.90. We want 10% of the area under the curve to lie outside this interval, leaving 5% to lie above the interval. We therefore determine z so that the area under the standard normal curve lying between 0 and z equals 0.45 (a picture helps). The result is z = 1.645. Conclusion: With probability 0.90, the value of x will lie in the interval
Review of the Central Limit Theorem Take ANY random variable X and compute m and s for this variable. If samples of size n are randomly selected from the population, then: 1) For large n, the distribution of the sample means, will be approximately a normal distribution, 2) The mean of the sample means will be the population mean m and 3) The standard deviation of the sample means will be
The Sampling Distribution of X and the Central Limit Theorem Assume a population with = 80, = 6. If a sample of 36 is taken from this population, what is the probability that the sample mean is larger than 82? Sketch the curve of x and identify area of interest
The Sampling Distribution of X and the Central Limit Theorem Convert 82 to z value First, calculate the standard deviation of the sampling distribution Then calculate the z value Use the tables to find probability of interest
Example Suppose you took a sample of 100 accounts from Visa and found the mean balance was $213. What can you say about the mean balance of ALL Visa accounts.
Example Suppose you took a sample of 100 accounts from Visa and found the mean balance was $213. What can you say about the mean balance of all VISA accounts? ANS: That it is approximately $213. (This is called a point estimate).
Example Suppose you took a sample of 100 accounts from Visa and found the mean balance was $213. What can you say about the average balance of all VISA accounts? ANS: That it is approximately $213. (This is called a point estimate). We would LIKE an interval estimate, i.e., an interval in which we will have confidence that the true value of the population mean lies.
Interpretation • If samples of size 100 were taken respectively, then with probability 0.95 (i.e., 19 times out of 20), the true value of the population mean would be included in the interval constructed using the procedure outlined above.
Possible was in which this would be stated in a news report A recent survey of 100 Visa accounts showed that the average Visa account is $213. This finding is valid with a margin of error of $21.95 with 95% confidence. This means that if the survey were repeated many times, 19 times out of 20 the true mean would lie in the interval obtained.
General Confidence Intervals A confidence interval(or interval estimate) is a range of values that estimates the true value of the population parameter. This is associated with a degree of confidence, which is a measure the probability that a randomly selected confidence interval encloses the population parameter.
Confidence Level The confidence level is equal to 1- , and is split between the two tails of the distribution Usually the confidence level is: 90% (meaning ) 95% (meaning ) OR 99% (meaning )
Confidence Intervals The Confidence Interval is often expressed as: E is called the margin of error. For samples of size > 30,
Typical values for 95% confidence interval 90% confidence interval
NOTE If you increase the confidence level, the size of the confidence interval increases. This makes sense. If the a sample of 100 students is taken and the mean age computed, I would probably be very confident the mean age is between 18 and 24, but less confident the mean age is between 20 and 22.
Example Suppose you took a sample of 100 accounts from Visa and found the mean balance was $213. If in addition you know the standard deviation for all accounts is $112, what can you say about the average balance of all VISA accounts? Build a 95% confidence interval.
Example Suppose you took a sample of 100 accounts from Visa and found the mean balance was $213. If in addition you know the standard deviation for all accounts is $112, what can you say about the average balance of all VISA accounts? Build a 95% confidence interval.
Example Suppose you took a sample of 100 accounts from Visa and found the mean balance was $213. If in addition you know the standard deviation for all accounts is $112, what can you say about the average balance of all VISA accounts? Build a 90% confidence interval.
Example Suppose you took a sample of 100 accounts from Visa and found the mean balance was $213. If in addition you know the standard deviation for all accounts is $112, what can you say about the average balance of all VISA accounts? Build a 90% confidence interval.
Example Suppose you took a sample of 100 accounts from Visa and found the mean balance was $213. If in addition you know the standard deviation for all accounts is $112, what can you say about the average balance of all VISA accounts? Build a 99% confidence interval.
Example Suppose you took a sample of 100 accounts from Visa and found the mean balance was $213. If in addition you know the standard deviation for all accounts is $112, what can you say about the average balance of all VISA accounts? Build a 99% confidence interval.
Age of STFX Students Find the 90% confidence interval for the mean.
Age of STFX Students Find the 90% confidence interval for the mean.
Sample Size The sample size needed to estimate m so as to be (1-a)*100 % confident that the sample mean does not differ from m more than E is: …round up