Download

1 / 20
200 likes | 405 Views
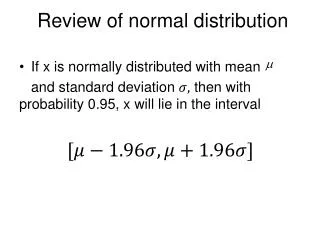
REVIEW Normal Distribution. Characterizing a Normal Distribution. To completely characterize a normal distribution, we need to know only 2 things: The mean --- The standard deviation --- . HAND CALCULATIONS FOR THE NORMAL DISTRIBUTION.

E N D
REVIEW Normal Distribution
Characterizing a Normal Distribution To completely characterize a normal distribution, we need to know only 2 things: • The mean --- • The standard deviation ---
HAND CALCULATIONS FOR THE NORMAL DISTRIBUTION • Probability tables have been created for the normal distribution expressed in terms of z, where • z = the number of standard deviations x is from its mean, , i.e.
TYPES OF NORMAL TABLES • Two types of normal tables • Tables giving probabilities from z = 0 to a positive value of z • Cumulative normal tables giving probabilities from z = -∞ to any value of z • Excel uses this approach
Some tables give probability of falling between 0 and a positive z value a X Normal Curve with X and Z ScalesProbabilities from 0 to z µ a X 0 z Z
A cumulative normal table gives the probability of falling between -∞ and any z value a X Curve with X and Z ScalesCumulative Probabilities from -∞ to z µ a X 0 z Z
Calculating Normal Probabilities Using Cumulative ProbabilitiesLEFT TAIL PROBABILITIES P(X<a) or P(Z<z) = area between -∞ and a (or z) • Probability to the left • Cumulative normal table value EXCEL: =NORMDIST(a,µ,σ,TRUE) or =NORMSDIST(z)
Calculating Normal Probabilities Using Cumulative ProbabilitiesRIGHT TAIL PROBABILITIES P(X>a) or P(Z>z) = area between a (or z) and +∞ • Probability to the right • 1 - (Cumulative normal table value) EXCEL: =1-NORMDIST(a,µ,σ,TRUE) or =1-NORMSDIST(z)
Calculating Normal Probabilities Using Cumulative ProbabilitiesIN BETWEEN PROBABILITIES P(a<X<b) or P(za<Z<zb) • Probability between a and b on the X scale or between za and zb on the Z scale • (Cumulative normal table value for zb) - (Cumulative normal table value for za) EXCEL: =NORMDIST(b,µ,σ,TRUE) - NORMDIST(a,µ,σ,TRUE)or =NORMSDIST(zb) - NORMSDIST(za)
Calculating x Values from Cumulative Normal Probabilities Determining the x value such that the probability of getting a value less than x is p • Find the cumulative normal probability, p, (approximately) in the table (to the leftof x) and note the corresponding z value • x = µ + zσ EXCEL: = NORMINV(p,µ,σ) or = µ + NORMSINV(p)*σ
EXAMPLE • Flight times from LAX to New York: • Are distributed normal • The average flight time is 320 minutes • The standard deviation is 20 minutes
Probability a flight takes exactly 315 minutes • P(X = 315 ) = 0 • Since X is a continuous random variable
Probability a flight takes less than 335 minutes FROM TABLE .7734 .4332 335 σ = 20 320 X 0.75 0 Z EXCEL =NORMDIST(335,320,20,TRUE) OR =NORMSDIST(.75)
Probability a flight takes more than 325 minutes FROM TABLE .5987 1 - .5987 = .4013 .4332 325 σ = 20 320 X 0.25 0 Z EXCEL =1-NORMDIST(325,320,20,TRUE) OR =1-NORMSDIST(.25)
Probability a flight takes between 303 and 348 minutes .9192 - .1977 = .7215 FROM TABLE .9192 FROM TABLE .1977 .4332 303 348 σ = 20 320 X -0.85 1.40 0 Z EXCEL =NORMDIST(348,320,20,TRUE)-NORMDIST(303,320,20,TRUE) OR =NORMSDIST(1.40)-NORMSDIST(-0.85)
75% of the flights arrive within how many minutes? .7500 is to the left of x x = 320 + .67(20) .4332 The closest value is .7486 which corresponds to a z-value of 0.67. x 333.4 0.67 σ = 20 Try to find .7500 in the middle of the cumulative normal table. 320 X 0 Z EXCEL =NORMINV(.75,320,20) OR =320 + NORMSINV(.75)*20
85% of the flights take at least how many minutes? Thus, 1-.8500 = .1500 is to the left of x .8500 is to the right of x x = 320 + (-1.04)(20) .4332 The closest value is .1492 which corresponds to a z-value of -1.04 299.2 x -1.04 σ = 20 Try to find .1500 in the middle of the cumulative normal table. 320 X 0 Z EXCEL =NORMINV(.15,320,20) OR =320 + NORMSINV(.15)*20
REVIEW • Normal distribution is completely characterized by µ and σ • Calculation of: • “<” probabilities, “>” probabilities, and “in between” probabilities using: • Cumulative probability table • NORMDIST and NORMSDIST functions • “x values” and “z values” corresponding to a cumulative probability using: • Cumulative probability table • NORMINV and NORMSINV functions