Download
1 / 18
180 likes | 192 Views
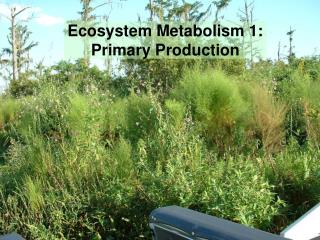
This study evaluates primary production and nutrient cycling processes in the photic zone at Station ALOHA and K2 using various isotopic and mass balance techniques. The results provide insights into the dynamics of phytoplankton nutrition and nitrogen remineralization rates.

E N D
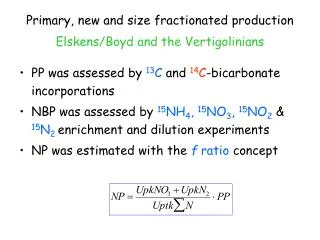
Primary, new and size fractionated productionElskens/Boyd and the Vertigolinians • PP was assessed by 13C and 14C-bicarbonate incorporations • NBP was assessed by 15NH4, 15NO3, 15NO2 & 15N2enrichment and dilution experiments • NP was estimated with the f ratio concept
Protocol 14C* • All incubations were conducted at 6 depths over one daylight period in a on-deck incubator with filters to simulate the light quantity and color at the appropriate depths. • PP was integrated using the trapezoid rule in the upper 100m (ALOHA) and 50m (K2) • Size fractionated PP was performed on >20, 5-20, 2-5 and 0.2-2µm. * JGOFS protocol
Protocol 13C* and 15N* • Kinetic experiments were conducted on deck in a simulated in situ light and temperature controlledincubator at 4 depths. • Gross NBP was determined using weighted least squares • NBP was integrated using the trapezoid rule in the upper 100m (ALOHA) and 50m (K2) * JGOFS protocols
Station ALOHA • PP Hot-14C (0-100m) • 461 ± 134 mg C m-2 d-1 (n=166) • PP VERTIGO-13C (0-100m) • 224 ± 26 mg C m-2 d-1 (n=8) • PP VERTIGO-14C (0-100m) • 198 ± 29 mg C m-2 d-1 (n=2) z-13C = -1.76 (p=0.039) z-14C = -1.96 (p=0.025) AOAC/IUAPAC rules |z| ≤ 2 satisfactory 2 < |z| ≤ 3 questionable |z| > 3 unsatisfactory
Relationship between the 13C and 14C-bicarbonate incorporation rates during Vertigo
Relative importance of nitrogenous substrates to phytoplankton nutrition
Nitrogen remineralisation rates:Compartmental model analysis where Xi is the N concentration of isotope p within compartment i at time t, kij is the rate constant for exchange from compartment i to compartment j (in reciprocal time units), p is the isotope 15N or 14N and n represents the number of compartments Three compartment open model describing exchange reactions between ammonium (A), nitrate (N) and particulate nitrogen (P). • The mass balance differential equations are solved numerically • Values for the rate constants are obtained with weighted least squares techniques
Depth-integrated bacterial mineralisation and ammonium production at K2 NH4 production is calculated using an isotope dilution model and represents both the ammonification (bacteria) and excretion (zooplankton) rates. BNR is calculated using the BCD* data with a conversion factor of 3. It represents ammonification only BCD data from Ben Van Mooy
Build-up of ammonium stock at K2 Slope = 6 ± 1 mmol m-2 d-1
Decrease of PN stock at K2 Slope = -1.1 ± 0.2 mmol m-2 d-1
Differential mass balance equations at ALOHA • dNH4/dt 0 = RNH4 – RNO2 – UNH4 • dNO2/dt 0 = RNO2 – RNO3 – UNO2 • dNO3/dt 0 = RNO3 –UNO3 • dPN/dt 0 = SN –LPN Variables in black represent direct fiel measurements, while those in red are obtained with mass balance constrains
570 ± 180 59 ± 20 DIN DIN orgN orgN - 97 395 ± 58 44 ± 20 NH4 NH4 + 175 RNP (0-50m) 15 ± 4 ns 4 ± 1 RNP (0-100m) NO2 NO2 ns 11 ± 4 ns 11 ± 4 95 ± 38 NO3 NO3 NNP (0-50m) 8 ± 3 NNP (0-100m) N2 N2 ns ExPN (150m) 9-25 ExPN (150m) 7 ± 2 95 Tentative of N cycle for the photic zone at Sta. ALOHA and K2 ALOHA K2 Unit µmol m-2 h-1 ExPN data from Ken Buesseler
PP (0-100m) 460 ± 134 PP (0-100m) 224 ± 26 RP: 199 ± 40 RP: 409 ± 82 BCD (0-100m) 503 ± 61 BCD (0-100m) 503 ± 61 NP: 25 ± 12 NP: 52 ± 24 BCD (100-150m) 47 ± 2 BCD (100-150m) 47 ± 2 ExPOC (150m) 19 ± 4 ExPOC (150m) 19 ± 4 Tentative of C cycle for the photic zone at Sta. ALOHA with median HOT PP with median VERTIGO PP Unit mg C m-2 d-1 BCD data from Ben Van Mooy and ExPOC data from Ken Buesseler
PP (0-50m) 404 ± 28 PP (0-50m) 523 ± 117 RP: 404 ± 84 RP: 336 ± 34 BCD (0-50m) 343 ± 18 BCD (0-50m) 328 ± 72 NP: 119 ± 42 NP: 67 ± 23 BCD (50-150m) 10 ± 5 BCD (50-150m) 9 ± 4 ExPOC (150m) 68 ± 2 ExPOC (150m) 23 ± 2 Tentative of C cycle for the photic zone at Sta. K2 Deployment 1 Deployment 2 Unit mg C m-2 d-1 BCD data from Ben Van Mooy and ExPOC data from Ken Buesseler