Download
1 / 42
420 likes | 669 Views
OSPAR Workshop, Trondheim, 26-27 November 2004. How can injected CO 2 be monitored?. Barthold Schroot, geophysicist / project manager. Outline of this presentation. Why do we monitor? What do we mean by monitoring? Techniques available for monitoring

E N D
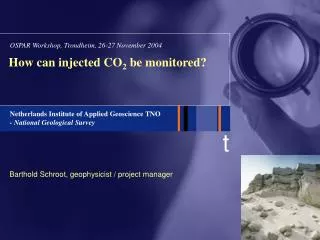
OSPAR Workshop, Trondheim, 26-27 November 2004 How can injected CO2 be monitored? Barthold Schroot, geophysicist / project manager
Outline of this presentation • Why do we monitor? • What do we mean by monitoring? • Techniques available for monitoring • What can we expect to see?Examples from: • Recent research w/r to underground storage of CO2 • Natural analogues • Conclusions Monitoring of injected CO2
Why do we need to monitor? Because • we want to be sure that CO2 stays where we put it (in case of geological storage) • Direct environmental concern: ensure that no leakage to shallower levels occurs • Economics / Climate Change Objectives: verify the amounts of avoided emissions (Emissions Trading Schemes) • we need to ensure that no other undesired effects will occur after subsurface injection • Think of geomechanical effects (subsidence or uplift of the surface or the seabed) Monitoring of injected CO2
What do we mean by monitoring? • Use techniques that enable us to “see” where the injected volume of CO2 is sitting (or where it might be moving to) CO2 escapescenarios Monitoring of injected CO2
Outline of this presentation • Why do we monitor? • What do we mean by monitoring? • Techniques available for monitoring • What can we expect to see? Examples from: • Recent research w/r to underground storage of CO2 • Natural analogues • Conclusions Monitoring of injected CO2
includes for example: seismic / acoustic properties: method: gravimetric Physical prop. Geophysical others (electric etc.) Chemical prop. Geochemical seabed sediment samples water samples Monitoring techniques What properties do we measure? Where do we measure? 1) at or near the surface 2) in existing or new boreholes (wells) Monitoring of injected CO2
Monitoring techniques • Common to all techniques:we are looking for anomalies • A ‘baseline’ reference measurement (before the start of injection) is recommendable. • Jargon: geophysical anomalies geochemical anomalies Monitoring of injected CO2
(Geo)physical techniques at surface • A very powerful tool is the 3D surface seismic method (seismic imaging) • Repeated surveys : time lapse seismic / 4D seismic => changes in time Monitoring of injected CO2
Physical techniques in wells Monitoring of injected CO2
Geochemical sampling & analysis(at or near the surface) Monitoring of injected CO2
Outline of this presentation • Why do we monitor? • What do we mean by monitoring? • Techniques available for monitoring • What can we expect to see?Examples from: • Recent research w/r to underground storage of CO2 • Natural analogues • Conclusions Monitoring of injected CO2
Sleipner gas field: CO2 injection project • Average injection of 1 Mtonnes of CO2 per year • Injection started in 1996 Location of the Sleipner-East fieldNorthern North Sea Courtesy NPD Monitoring of injected CO2
Storage location Sleipner: application of 4D seismic method Courtesy Statoil Monitoring of injected CO2
800 m 1994 1999 1200 m 2001 2002 Sleipner: repeated 3D surveys reveal presence of CO2 injectedsince 1996 Monitoring of injected CO2
Changes in acoustic velocity result indifferent expression on seismic data Compressional (P) wave velocities for different compressibilities C of the CO2 Low C High C Seismic velocity (m/s) Shear wave velocity insensitive to saturation or compressibility C of the CO2 High CO2 saturation Low CO2 saturation Monitoring of injected CO2
Stacked CO2 saturated layers Sleipner: seismic data -> geological interpretation and modelling Monitoring of injected CO2
Sleipner: Seafloor micro-gravity method Monitoring of injected CO2
Sleipner: Instrument fixed on concrete benchmarks at seabed Monitoring of injected CO2
Sleipner: Gravity modeling of assumed 21 million tonnes of CO2(5 mGal detectable) Modelledgravityanomaly due topresence of CO2 Monitoring of injected CO2
CO2 bubbles The study of natural analogues:Naturally occurring CO2 (and CH4) seepage E.g. in the EU sponsored 5th FW project NASCENT about natural analoguesfor CO2 in the geological environment Matra mountains, Hungary www.bgs.ac.uk/nascent Monitoring of injected CO2
One part of NASCENT project:monitoring shallow gas and methane seepagein the Southern North Sea Rational: examining expressions of shallow gas (methane) in the North Sea will result in an assessment of monitoring capabilities,also applicable to monitoring CO2 In the Netherlands offshoremost reports of shallow gasare from the northernmost sector Monitoring of injected CO2
Hull mounted or floating single channel 3.5 kHz system (sub-bottom profiler) Marine seismic data acquisition Images the shallowest tens of meters below sea bed, but also effects in the water column Images up the 5000 meters belowsea bed Marine acoustic and seismic surveys Monitoring of injected CO2
3.5 kHz sub-bottom profiler data:Seabed pockmark associated withventing of gas (pockmark diameter ~ 40m depth ~ 2m) 3.5 kHz data:Acoustic blanking due to gas saturation of shallow layers High frequency acoustic (sub bottom profiler data Monitoring of injected CO2
Shallow enhanced reflectors on 2D seismic line (example block F7) Monitoring of injected CO2
Phase shift Multiple of thefirst gas-sand ?? Shadow zone Shallow enhanced reflectors on 3D seismic survey (example block E17) These are seismic anomaliescorresponding to gas saturation of shallowest layers. Monitoring of injected CO2
Glacial Channels? Shallow enhanced reflectors on 3D seismic survey (example block E17) Time-slice at 152 msec Profile from previous slide Monitoring of injected CO2
Area 1 (A11) Area 2 (B13) Area 3 (F3) Selected areas in the NASCENT project • Acquired new data: • Multi-beam echo • High frequency (acoustic) sub-bottom profiler data • 2D seismic data • 60 vibrocores: • core description • headspace gas analysis=> C1, C2 concentrationsand isotope analysis(δ13C of C1) Monitoring of injected CO2
Marine acousticand seismic surveys Multi-beam seabed imaging :vertical resolution is high (cms) Monitoring of injected CO2
Seabed sediment sampling Vibrocoring method for sea bed sediment sampling(North Sea : 2-5 m depth) Monitoring of injected CO2
Area 1: A seabed pockmark in block A11multi-beam image & headspace gas analysis • Multi-beam image showsseabottom morphology:depression = seabed pockmark • Geochemical analysis:122.6 ppm CH4represents ageochemical anomaly Monitoring of injected CO2
Area 2: Gas plumes in the water columnexample from block B13 Anomaly: up to 10,395 ppm methane in seabed sediment Monitoring of injected CO2
Gas plumes in the water columnexample from block B13 (area # 2) High frequency sub-bottom profiler record (TNO, 2002): Active venting observed in block B13 over a Plio-Pleistocene shallow gas field Associated : geochemical anomalies (up to 10,395 ppm methane) Monitoring of injected CO2
Underlying Plio-Pleistocene shallow gas field (block B13) plume Bright spot Mioceneunconformity Monitoring of injected CO2
Area 3: block F3various subsurface indications for gas Legend: C1 concentrations in headspace (black) δ13C of C1 in red Key vibrocore numbers in blue Monitoring of injected CO2
Gas leaking along faults and fracturesexpresses itself on seismic profiles Example from Southern North Sea (Dutch sector) Monitoring of injected CO2
Gas leaking along faults and fracturesexpresses itself on seismic profiles Example from offshore Nigeria, courtesy Addax Petroleum Ltd Monitoring of injected CO2
Gas chimney seen on seismic data(block F3/F6) Gas Chimney Monitoring of injected CO2
Gas chimney above a Plio-Pleistocene bright spot(gas accumulation) Map view W E 3750m View direction 16 parallel seismic lines from a 3D surveyLine spacing 250 meters Viewed from north to south Monitoring of injected CO2
100 m 400 m Pliocene shallow gas accumulation (~ 500 m) Gas chimney above Pliocene bright spot (Dutch offshore),indicating leakage to the seabed; expression on profiles 1000m Chimney Velocity pull-down Monitoring of injected CO2
Gas chimney above Pliocene bright spot (Dutch offshore), indicating leakage to the seabed; expression in map view Monitoring of injected CO2
Outline of this presentation • Why do we monitor? • What do we mean by monitoring? • Techniques available for monitoring • What can we expect to see?Examples from: • Recent research w/r to underground storage of CO2 • Natural analogues • Conclusions Monitoring of injected CO2
Conclusions • Various geophysical and geochemical monitoring techniques can be applied to reveal the presence of gas (CO2 orCH4) in the subsurface • Of these techniques 4D seismic monitoring is a very powerful method (covering large areas with high resolution) • In case of leakage to the surface techniques exist to measure quantities and fluxes • Geophysical techniques can be used for ‘early warning’ • With geochemical techniques (at surface or in wells) more acurate quantifications can be made • Each case requires a site-specific monitoring strategy depending on an initial risk analysis and on subsurface modelling • How frequently and for how long a period should we monitor ? • Should we go for permanent monitoring systems ? Monitoring of injected CO2