Download
1 / 18
180 likes | 204 Views
Learn about macroeconomics, GDP, economic growth, stability, and employment goals. Explore measures of GDP, factors affecting economic activity, and the difference between nominal and real GDP.

E N D
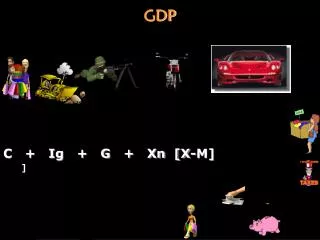
Macroeconomics and GDP SSEMA1 Illustrate the means by which economic activity is measured. Identify and describe the macroeconomic goals of steady economic growth, stable prices, and full employment. b. Define Gross Domestic Product (GDP) as the sum of Consumer Spending, Investment, Government Spending, and Net Exports (output expenditure model).
Macroeconomics and GDP • What is Macroeconomics ? the part of economics concerned with large-scale or general economic factors, such as interest rates and national productivity. • What is an aggregate? As a whole • What are Macroeconomic issues? • Unemployment, GDP, Inflation, Economic growth, Monetary Policy, Fiscal Policy
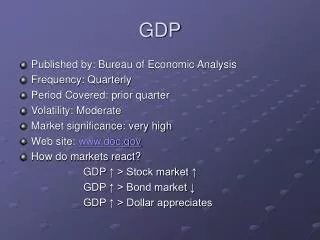
What are measures of Economic Growth? What is 'Gross Domestic Product - GDP' Gross domestic product (GDP) is the monetary value of all the finished goods and services produced within a country's borders in a specific time period • Gross National Product (GNP) • GNP is a measure of the market value of all goods and services produced by Americans in one year.
Excluded from GDP • GDP does not take into account certain economic activities, such as: • Nonmarket Activities :GDP does not measure goods and services that people make or do themselves, such as caring for children, mowing lawns, or cooking dinner. • GDP ignores: household work, barter, financial transactions such as buying stock, and transfer payments such as Social Security. • 2. Transfer payments:payments from the government like Social Security or welfare. • 3. Securities payments-income on stocks or bonds.
4. Underground (black market):includes illegal activities as well as questionable, or gray, ones (not quite legal, but not exactly illegal). Ex. Cash only transactions that never get reported to the IRS: mowing lawns, babysitting, garage sales, flea markets, or unlicensed businesses working out of homes. What it the economic effect of a recession on the underground economy? It tends to grow when the economy is weak. Cash transactions replace reported purchases and income.
5. Not sold this year or secondhand sales:If a product is not sold it cannot be included in this year’s GDP. When a product is resold from one person to another no new wealth is created. Therefore, only the original sale is included in GDP. 6. Intermediate Products-products used to make other products • E. Example: A tomato in a hamburger.
Understanding Checkpoint: Answer the questions on the worksheet given to you at the beginning of class.
Real GDP is GDP expressed in constant, or unchanging, dollars. Nominal GDP is GDP measured in current prices. It does not account for price level increases from year to year. Nominal and Real GDP Year 1 Nominal GDP Year 2 Nominal GDP Year 3 Real GDP Suppose an economy‘s entire output is cars and trucks. In the second year, the economy’s output does not increase, but the prices of the cars and trucks do: To correct for an increase in prices, economists establish a set of constant prices by choosing one year as a base year. When they calculate real GDP for other years, they use the prices from the base year. So we calculate the real GDP for Year 2 using the prices from Year 1: This year the economy produces: 10 cars at $16,000 each = $160,000 + 10 trucks at $21,000 each = $210,000 Total = $370,000 10 cars at $15,000 each = $150,000 + 10 trucks at $20,000 each = $200,000 Total = $350,000 This new GDP figure of $370,000 is misleading. GDP rises because of an increase in prices. Economists prefer to have a measure of GDP that is not affected by changes in prices. So they calculate real GDP. Since we have used the current year’s prices to express the current year’s output, the result is a nominal GDP of $350,000. 10 cars at $15,000 each = $150,000 + 10 trucks at $20,000 each = $200,000 Total = $350,000 Real GDP for Year 2, therefore, is $350,000 Real and Nominal GDP
Aggregate Supply Aggregate supply is the total amount of goods and services in the economy available at all possible price levels. As price levels rise, aggregate supply rises and real GDP increases. Aggregate Demand Aggregate demand is the amount of goods and services that will be purchased at all possible price levels. Lower price levels will increase aggregate demand as consumers’ purchasing power increases. Factors Influencing GDP Aggregate Supply/Aggregate Demand Equilibrium • By combining aggregate supply curves and aggregate demand curves, equilibrium for the macroeconomy can be determined.
Measuring Economic Growth The basic measure of a nation’s economic growth rate is the percentage change of real GDP over a given period of time. GDP and Population Growth- In order to account for population increases in an economy, economists use a measurement of real GDP per capita. It is a measure of real GDP divided by the total population. • Real GDP per capita is considered the best measure of a nation’s standard of living. GDP and Quality of Life- Like measurements of GDP itself, the measurement of real GDP per capita excludes many factors that affect the quality of life.
What Is a Business Cycle? A business cycle is a macroeconomic period of expansion followed by a period of contraction. • A modern industrial economy experiences cycles of goods times, then bad times, then good times again. • Business cycles are of major interest to macroeconomists, who study their causes and effects. • There are four main phases of the business cycle: expansion, peak, contraction, and trough.
Phases of the Business Cycle Expansion- An expansion is a period of economic growth as measured by long-term rise in real GDP. Peak- When real GDP stops rising, the economy has reached its peak, the height of its economic expansion. Contraction- Following its peak, the economy enters a period of contraction, an economic decline marked by a fall in real GDP. A recession is a prolonged economic contraction (6 months or more). An especially long or severe recession may be called a depression. Trough- The trough is the lowest point of economic decline, when real GDP stops falling.
What Keeps the Business Cycle Going? • Business cycles are affected by four main economic variables: Business Investment When an economy is expanding, firms expect sales and profits to keep rising, and therefore they invest in new plants and equipment. This investment creates new jobs and furthers expansion. In a recession, the opposite occurs. Interest Rates and Credit When interest rates are low, companies make new investments, often adding jobs to the economy. When interest rates climb, investment dries up, as does job growth. Consumer Expectations Forecasts of a expanding economy often fuel more spending, while fears of recession tighten consumers' spending. External Shocks External shocks, such as disruptions of the oil supply, wars, or natural disasters, greatly influence the output of an economy.
Business Cycles- What is happening to the following during expansion and contraction?
Business Cycles- What is happening to the following during expansion and contraction?
Historical Business Cycle Fluctuations The Great Depression • The Great Depression was the most severe downturn in the nation’s history. • Between 1929 and 1933, GDP fell by almost one third, and unemployment rose to about 25 percent. Later Recessions • In the 1970s, an OPEC embargo caused oil prices to quadruple. This led to a recession that lasted through the 1970s into the early 1980s. U.S. Business Cycles in the 1990s • Following a brief recession in 1991, the U.S. economy grew steadily during the 1990s, with real GDP rising each year.