GDP
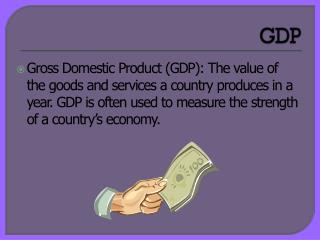
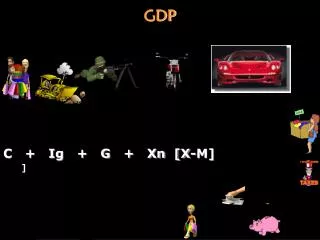
GDP. C + Ig + G + Xn [X-M] ]. Gross Domestic Product – market value of all final legal output produced in a country in one year. N ominal (money) GDP =$ 6.00. Year one. $2.00. $2.00. $2.00. N o minal (money) GDP =$6.10. Year Two. [R ecession - decrease in output].

GDP
E N D
Presentation Transcript
GDP C + Ig + G + Xn [X-M] ]
Gross Domestic Product – market value of all final legal output produced in a country in one year. Nominal (money) GDP =$6.00 Year one $2.00 $2.00 $2.00 Nominal (money) GDP =$6.10 Year Two [Recession - decrease in output] $3.05 $3.05 Real GDP – measures only output. [measures current output at base-year prices ($4), not current prices ($6.10)].
Gross Domestic Product What’s a Gross Domestic Product? I was gonna say “Preparation H.” Broccoli? So – “gross”, or “entire” means broccoli, Preparation H, and the “entire sum of all products produced in a year.”
GNP – Ownership All goods/services produced legally for paybycitizens of a country. [Citizenship mattered,not geography] China Europe Nike in Indonesia Plano, TX in Chicago GDP - Location All goods/services produced legally for pay ina country’s borders. [Geography matters,not citizenship] Provo,UT BMW in Waco Honda in Ohio The difference between GDP & GNP is about 2/10 of 1%.
Real Gross Domestic Product - Health of the Economy Longest expansion in history Real GDP-most imp. stat in economics.
Economy’s Speed Limitat Full Employmentis4%,instead of2.5%. Can sustain a much greater increase in AD if the AS curve is also shifting to the right, due to increasing productivity. In the early 90’s, at FED, 2.5% was the speed limit. AS shifted slowly due to low productivity. AD2 AD1 AS1 AS2 PL2 Increasing productivityof the late 90’s allowed more growth at full employment. PL3 PL1 PL1 So, at FED, the“goldilocks economy”has expanded. Y*1 Y2 Y3 0 Real GDP 2.5%
GDP <10 years without a recession> *Represents“GDP Speed Limit”at full employment
EXPENDITURES APPROACH GDP = C(66%) + Ig(18%) + G(17%) + Xn Personal Consumption Expenditure ( C ) • Durable ConsumerGoods[12%] • Nondurables[29%][soup & soap] • Consumer Expenditures for Services[59%] Maytag produced here Ferrari produced here
Households As Spenders COMPOSITION OF CONSUMER Spending, 2002 Total of $7,304 billion Services $4,317 billion (59%) Durable Goods $872 billion (12%) Nondurable Goods $2,115 billion (29%)
EXPENDITURES APPROACH Personal Consumption Expenditure ( C ) Gross Private Domestic Investment ( Ig ) Government Purchases (G) [state, local & federal] [“G” purchases of goods/svcs produced (not transfer payments) 3 Subcategories of Government A. Federal government [40%] B. 50 State governments C. 84,000 local governments [60% for state and local]
GDP 2005 [$12,486 Trillion] Consumption $8,534 Government purchases $2,260 Investment $2,085 Export Spending $1,210 Import Spending $1,938
Average % Increases in Real GDP, 1900-2006 Long Term Growth 5% 4.5% 3.5 3.8% 4% 3.3% 3.2% 3% 2.7% 2.8% 2.6% 2% 0.8% 1% 0 1990 To 2000 1929 To 1940 1950 To 1960 1940 To 1950 1960 To 1970 1970 To 1980 1980 To 1990 1929 To 2000 1900 To 2006
GLOBAL PERSPECTIVE Comparative GDPs in Trillions, 2006 0 1 2 3 4 5 6 7 8 9 10 11 12 13 14 U.S. Japan Germany China U.K. France Italy Canada Spain Brazil S. Korea India Mexico Russia Australia 13 4.5 2.8 2.7 2.2 2.2 1.7 1.1 1.1 .795 .790 .780 .770 .763 .708
GLOBAL PERSPECTIVE Comparative GDPs in Trillions, 2006 0 1 2 3 4 5 6 7 8 9 10 11 12 13 14 U.S. Japan Germany China U.K. France Italy Canada Spain Brazil S. Korea India Mexico Russia Australia 13 4.5 2.8 If California and Texas were countries, where would they rank? 2.7 2.2 2.2 1.7 Calif. 1.7 1.1 1.1 TX 1.0 795 .790 780 770 763 708
We make up4.7%of the world’s population, but produce 22% of GDP [output]. Gross World Product is $60 trillion/6.5 billion=$9,500 So, World Per Capita is about$9,500. China, India, Indonesia, & Bangladesh have over 40% of the world’s population, but produce only 7% of the world’s GDP. California, with a $1.7 trillion GDP would be number 7. Texas, at $1 trillion would be the 10th largest country. Texas produces 20% more than India. We have 22% of the world’s GDP, 25% of global trade, 40% of world stock market capitalization, and nearly 50% of the world’s largest companies.
Per Capita GDP – 2005[Selected Countries] Country Per Capit United Kingdom $24,700 Sweden 24,700 Italy 24,300 Australia 24,000 New Zealand 19,500 Greece 17,900 Hungary 12,000 Mexico 6,770 China 1,290 Pakistan 600 Rwanda 220 Liberia 110 Country Per Capita Luxembourg 55,600 Switzerland 48,230 U.S. $44,000 Japan 37,180 Norway 30,800 France 30,090 Denmark 29,800 Canada 29,700 Austria 27,000 Germany 27,000 Belgium 26,100 China and India are still poorer than he U.S. was in 1900. 46% of Africans live on less than $1 a day & it is getting worse.
GDP Over The Decades 13 tril. 12 tril. 10 tril. 9 tril. 8 tril. 7 tril. 6 tril. 5 tril. 4 tril. 3 tril. 2 tril. 1 tril. 0 13 tril. Per Capita $44,000 [If GDP increases, per capita income increases] 4,152 3,187 2,416 1,665 1,204 773 709 1929 1940 1950 1960 1970 1980 1990 2006
The World's Have-nots $44,000 2006 There are 6.5 billion peopleon our planet;5 billion are in the Third World.2.5 billionlive on less than $2 a day.Thedirest poverty is inAfrica, home of the world’s 10poorest countries. Over ½ the people of Sub-Sahara Africa live on less than$2 a day. 8 million people die each year because they are too poor to stay alive. ½ of the world’s population have yet to make their first phone call. $25,989 1996 The PoorestNations Nation Per Capita 1.Afghanistan $125 2. Sierra Leone $510 3. Ethiopia $600 4. Somalia $600 5. Congo $600 6. Eritrea $710 7. Tanzania $710 8. Burundi $720 9. Rwanda $900 10. Malawi $900 11. Mozambique $1,000 Djibouti $1,300 GDP Per Capita [in 1992 dollars] $15,931 1967 $6,538 1929
GDP – measures legal production in U.S. in one year. What 8 Things Do Not Count In GDP GDP measures all final goods/services produced byworkers and capital located in the U.S., regardless of ownership. [Domestically located resources]
What Eight Things Do Not Count In GDP? 1.Intermediate Goods– components of the final good. A. Ford buysbatteries or tiresfor its cars. B. KFC buyschickensto eventually sell to customers.
Value Added – increase in the market value at each stage Only Final Sales($20)Count[to prevent “multiple counting”($38)] $20 “Wife-beater” Shirt from Kohls Final Good Retail Shirt $20 $8 Intermediate Good 8 Wholesale Shirt $12 $7 $7 Value Added ($) Value of Output($) 7 Cloth $5 $4 $4 $4 4 Cotton $1 $1 $1 1 $1 $1 0 Shirt Manufacturer Cotton Farmer Textile Mill Retail Store $20 = sum Sum = $38 So, to avoid“multiple counting”, we count the$20final price, not$38.
Production of Bread . Value Added $2.02
GDP - what is not counted [#2] 2.Second Hand Sales– no current production. A. If a1957 Chevyis bought in 2005 57 Chevy Car salesman [It hasnot been produced againso would not count.] The salesman is doing productive work. Hiscommission would count. B.Boots produced in 1980are bought in a Thrift Store in 05. They also havenot been produced again. Salesman’scommission would count. You are buying his services. Shoe salesman
GDP– what is not counted [#3] 3. Purely Financial Transactions – stocks, bonds, CDs. There is no current production. Ex: If 100 shares of Dell stock is bought Buying stock is not buying a product butbuying ownership of the firm. I’m not buying a Dell computer but part ownership of Dell. Exchanging one financial asset for another
GDP– what is not counted [#4]. 4.Transfer Payments –welfare, unemployment, social security. [There is nocontribution to final production] “Now that I’ve gotten my welfare check, I can get an iPod nano and listen to 1,000 songs”
5.Unreported “Legal” Business Activity Unreported“legal”business activity does not count. This istwo-thirdsof the“underground economy.” Before LASIK Surgery And what if the dentistdoesn’t report $400 for teeth whitening? Then he has LASIK but the surgeondoesn’t report $500of his $3,400 bill? And what if this waitressdoesn’t report all tips?
6.Illegal business activity is also not counted. Illegal business activity, because it goes unreported, also does not count. Making up 1/3 of the “underground economy,” it includes murder for hire, gambling, drugs, and prostitution. “I’m getting $1,000 to kill you, Ziggy, but at least it will not count in GDP.”
U.S. Underground Economy Illegal $300 B Legal $600 B Drugs $120 Self Employment $255 Bribery $35 Gambling and Loan Sharking $10 Other Legal $25 Rents & Royalties $30 Pornography $20 Fraud $30 Corporate Profits $50 Other Illegal $20 Prostitution $30 Interest $55 Stolen Goods $35 Wages and Salaries $185 What gets reported is the “Above Ground” What doesn’t get reported is the “Underground”
U.S. Underground Economy Underground Economy[compared to “above ground”] Unreported exchanges that takeplace - legaland Illegal [Hidden – “off the books”] Totalillegal activities -$300 billion Total legal activities -$600 billion Total legalandillegal- $900 billion Underground Economy 1.Illegal business activities (1/3)– gambling, narcotics trade, prostitution, loan sharking, etc. 2.Unreported legal business activities (2/3) a. waitresses not reporting all of her tips b. Cabdriver not reporting all of his income c. Self employed cheat the most. Off-the-books cash transactions d. $300 billion *IRS estimates that about $300 billion in income taxes from the underground economy escapes federal taxes each year. $300 B
Underground Economy as a Percentage of GDP [Select Nations] Percentage of GDP 0 5 10 15 20 25 30 Greece Italy Spain Portugal Belgium Sweden Germany France Holland United Kingdom Japan United States Switzerland Source: Journal of Economic Literature
7.Non-market Transactions Are Not Counted Work in yourown householdorvolunteer workin the community does not count because there was no payment. You need to do some of this housework.
7.Non-market Transactions Are Not Counted Work in yourown householdorvolunteer work in the community does not count because there was no payment. So,don’t marry your maid, gardener, or fitness instructor, or you will hurt GDP.
8. U.S. Corporations Producing Goods Overseas GM in France Nike in Indonesia IfU. S. corporationsproduce goods overseas, it does not count in GDP, but would count in GNP. Remember, we are measuring production inside the U.S. Imports represent production outside of the U.S.
Eight Things Not Counted in GDP [no production] • Second Hand Sales[no production] • Public/Private Transfer Payments • Purely Financial Transactions • Intermediate Goods 5. U.S. Corporations producing overseas 6. Non-market transactions [household or volunteer work] Underground Economy 7. Illegal business activity 8. Unreported legal business activity
Do These Count in GDP? -When Outback buys potatoes for baked potatoes • When a tattoo business buys ink for tattoos • When Tom Thumb buys spam to sell it to you • When the popsicle maker buys the sticks • Dell buys a computer monitor frame • Ice cream that Braums buys for sundaes • A bakery buys an apple to put in its pies • When Ford buys a windshield wiperfor a car
Does Her Work Count? It depends on whether she is the maid or housewife.
And – What About This Work? Depends on whether he is the owner or hired mechanic.
Simon Kuznets and Sir Richard Stone Simon Kuznets Father of GDP - gave “quantitative precision to to economic entities” Sir Richard Stone After WWII, Stone headed a U.N. project that developed a standard NIA model for other countries. Today, most countries follow these guidelines, making international comparisons possible.
GDP • GDP can be measured either by total spending on U.S. production or by total income received from that production. • Expenditure approach [C+Ig+G+Xn] • Adds up the aggregate expenditure on all final goods and services produced during that year • Income approach • Adds up the aggregate income earned during the year by those who produce that output
Importance of Real GDP in Determining aRecession Real GDP measures current output at base-year prices. Apple GDP Example A country produces 10 apples in base year x $1; Nominal and Real GDP both = $10 Year 2: A country produces 10 apples x $1.25; Nominal GDP=$12.50 (no recession but worse off) [Real GDP would = $10 (10 apples x $1)] Or Year 2: Acountry produces 9 apples x $1.25; Nominal GDP=$11.25 but real is $9 (9 apples x $1) (recessionalthough nominal GDP is up)
Nominal[money]GDPv.Real GDP An increase in prices and/or output will increase nominal GDP. Only an increase in output will increase real GDP. Nominal GDP could increase even if output falls. Real GDP = Nominal Y/GDP deflator x 100 So, nominal GDP measures output & prices. Real measures only output [actual production] Constant (real) GDPv.current (money) GDP
Nominal[ ] GDPv.Real GDP Base year[$50/$50=1x100=100] $46/$50x100=92 [deflation of 8%] Price of Market Basket(2001)[nominal GDP]$64 GDP Price Index = Price of same Market Basket(1998)x100;[Real GDP] $50x100=128 [GDP Deflator] in the base year (1998)[$64/128 x 100 = $50] Nominal [Current) GDP v. Real (constant) GDP
The “GDP” Balloon $6,736.9/126.1 x 100 = $5,342.5 Nominal – measured in terms of money. Real–measured in terms of goods/services. takes
Recession[Real, not nominal GDP has declined] Inflation component Real GDP 1990-91
The Business Cycle in U.S. History[10 Recessions since WWII, from 6 months to 16 months] Recessions 20 Annual growth 15 10 5 3 GROWTH RATE (percent per year) 0 -5 Zero growth Long-term average growth (3%) -10 2005 1930 1940 1950 1960 1970 1980 1990 2000
SHORTCOMINGS OF GDP Non-market Transactions don’t count Leisure isn’t factored in Improved Product Quality The Underground Economy GDP’s impact on the Environment Per Capita Output Countries with low GDP per capita have more infants with low birth weight, higher rates of infant mortality, higher rates of maternal mortality, higher rates of child malnutrition, and less common access to safe drinking water. Also, fewer goto school and they have fewer teachers. They have fewer TVsand telephones, fewer paved roads. They also win fewer Olympic medals.