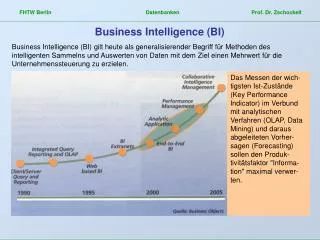
Business Intelligence (BI) Systems
Business Intelligence (BI) Systems. Business Intelligence (BI) Systems. Business Intelligence (BI) systems are information systems that assist managers and other professionals: To analyze current and past activities, and To predict future events. Two broad categories: Reporting Data mining.

Business Intelligence (BI) Systems
E N D
Presentation Transcript
Business Intelligence (BI) Systems • Business Intelligence (BI) systems are information systems that assist managers and other professionals: • To analyze current and past activities, and • To predict future events. • Two broad categories: • Reporting • Data mining
Data for BI Systems • BI systems obtain data in three ways: • From the operational database: • Read and process data only. • DO NOT insert, modify or delete operational data! • From extracts from the operational database: • Data is in a BI database. • May be a different database than the operational database. • From data purchased from data vendors.
Reporting Applications • Reporting system applications: • Filter • Sort • Group • Make simple calculations • Classify entities (customers, products, employees, etc.) • RFM Analysis: Customers are classified according to • how recently ( R ) a customer has ordered • how frequently (F) a customer orders • and how much money (M) a customer spends on an order. • Can be performed using standard SQL • Extensions to SQL are sometime used • OnLine Analytical Processing (OLAP). • Summarize current business status • Compare current business status to past or future • Deal with critical report delivery
What is Data Mining? • Decision support process in which we search for patterns of information in data. • Data mining uses sophisticated statistical analysis and modeling techniques to uncover such patterns and relationships hidden in organizational databases. • Once found, the information is presented in a suitable form such as reports, graphs, videos, etc.
Data Mining Applications • Data mining applications are used to: • Perform what-if analysis • Make predictions • Facilitate decision making
Data Warehouses and Data Marts: • The previous slide (#3) shows some BI systems reading and processing operational data directly from the operational database. • In larger applications it will be quite uneconomical. It can place a substantial burden on the DBMS • It can degrade performance considerably • The operational data may have problems that limit their use for BI applications • The creation and maintenance of BI systems require programs, facilities, and expertise that are not normally available from day-to-day operations.
Problems of Using Transaction Data for BI • Dirty data • Missing values • Inconsistent data • Wrong format • Too fine • Not fine enough • Too much data • Too many attributes • Too much volume
Data Warehouses and Data Marts:Components of a Data Warehouse
Data Warehouses and Data Marts:Data Warehouse Compared to Data Marts
Definition • Data Warehouse: A subject-oriented, integrated, time-variant, non-updatable collection of data used in support of management decision-making processes • Subject-oriented: e.g. customers, patients, students, products • Integrated: Consistent naming conventions, formats, encoding structures; from multiple data sources • Time-variant: Can study trends and changes • Non-updatable: Read-only, periodically refreshed • Data Mart: • A data warehouse that is limited in scope
Data Warehouse Architectures • Generic Two-Level Architecture • Independent Data Mart • Dependent Data Mart and Operational Data Store • Logical Data Mart and Active Warehouse • Three-Layer architecture All involve some form of Extraction, Transformation and Loading (ETL)
The ETL Process • Capture/Extract • Scrub or data cleansing • Transform • Load and Index ETL = Extract, Transform, and Load
Generic two-level architecture L One, company-wide warehouse T E Periodic extraction data is not completely current in warehouse
Data marts: Mini-warehouses, limited in scope L T E Separate ETL for each independent data mart Data access complexity due to multiple data marts Independent data mart
ODS provides option for obtaining current data L T E Simpler data access Single ETL for enterprise data warehouse (EDW) Dependent data marts loaded from EDW Dependent data mart with operational data store
Data Reconciliation • Typical operational data is: • Transient – not historical • Not normalized (due to de-normalization for performance) • Restricted in scope – not comprehensive • Sometimes poor quality – inconsistencies and errors • After ETL, data should be: • Detailed – not summarized yet • Historical – periodic • Normalized – Preferably BCNF • Comprehensive – enterprise-wide perspective • Timely – data should be current enough to assist decision-making • Quality controlled – accurate with full integrity
Reporting Systems:RFM Analysis • RFM Analysis analyzes and ranks customers according to purchasing patterns: • R = Recent (most recent order) • F = Frequent (how often an order is made) • M = Money (dollar amount of orders) • Customers are sorted into five groups, each containing 20% of the customers. • Each group is given a numerical value: • 1 = Top 20% • 2, 3, 4 = Each 20% in between top and bottom 20% • 5 = Bottom 20%
Reporting Systems:RFM Analysis Ajax ordered recently (1), orders often (1) but does not order the most expensive items (3) – Try to sell Ajax more expensive goods! Acme has not ordered recently (5), but has ordered often (1) and purchased the most expensive items (1). This customer may be looking for a different vendor – better call!
Reporting Systems: • SQL statements for RFM analysis where • R = Recent (most recent order) • F = Frequent (how often an order is made) • M = Money (dollar amount of orders)
Producing the RFM Report: • SQL statements for RFM analysis where • R = Recent (most recent order) • F = Frequent (how often an order is made) • M = Money (dollar amount of orders)
Producing the RFM Report: • Create tables from Slide #23 • CUSTOMER_RFM • CUSTOMER_R • CUSTOMER_F • CUSTOMER_M
Creating the RFM Analysis Tables CREATE TABLE CUSTOMER_RFM ( CustomerID int NOT NULL, R int, F int, M int, ); CREATE TABLE CUSTOMER_R ( CustomerID int NOT NULL, MostRecentOrderDate char (10), R_Score int, ); CREATE TABLE CUSTOMER_F( CustomerID int NOT NULL, OrderCount int, F_Score int ); CREATE TABLE CUSTOMER_M ( CustomerID int NOT NULL, AverageOrderAmount money, M_Score int );
RFM Analysis Procedures • Delete any existing RFM data • Compute RFM Scores • Display results
RFM Analysis stored Procedure (Fig. 15-10) CREATE PROCEDURE RFM_Analysis AS // Delete any existing RFM data DELETE FROM CUSTOMER_R; DELETE FROM CUSTOMER_F DELETE FROM CUSTOMER_M; // Compute RFM Scores Exec Calculate_R; //stored procedure Calculate_R defined later Exec Calculate_F; Exec Calculate_M; // Show results SELECT R_Score, Count(*) AS R_Count FROM CUSTOMER_R GROUP BY R_Score; SELECT F_Score, Count(*) AS F_Count FROM CUSTOMER_F GROUP BY F_Score; SELECT M_Score, Count(*) AS M_Count FROM CUSTOMER_M GROUP BY M_Score;
RFM Analysis stored Procedure – continued - UPDATE CUSTOMER_RFM SET R = SELECT R_Score FROM CUSTOMER_R WHERE CUSTOMER_RFM.CustomerID=CUSTOMER_R.CustomerID; SET F = SELECT F_Score FROM CUSTOMER_F WHERE CUSTOMER_RFM.CustomerID=CUSTOMER_F.CustomerID; SET M = SELECT M_Score FROM CUSTOMER_M WHERE CUSTOMER_RFM.CustomerID=CUSTOMER_M.CustomerID;
Calculate_R Stored Procedure • Place the date of each customer’s most recent order into the MostRecentOrderDate column • Use Top x% option of an SQL statement to set the R_Score values.
Calculate_R Stored Procedure CREATE PROCEDURE Calculate_R AS // compute R_Score INSERT INTO CUSTOMER_R (CustomerID, MostRecentDate) (SELECT CustomerID, Max(TransactionDate) FROM CUSTOMER_SALES GROUP BY CustomerID) UPDATE CUSTOMER_R SET R-Score = 1 WHERE CustomerID IN (SELECT Top 20 Percent CustomerID FROM CUSTOMER_R ORDER BY MostRecentOrderDate DESC); UPDATE CUSTOMER_R SET R-Score = 2 WHERE CustomerID IN (SELECT Top 25 Percent CustomerID FROM CUSTOMER_R WHERE R_Score IS null ORDER BY MostRecentOrderDate DESC);
Calculate_R Stored Procedure – continued - UPDATE CUSTOMER_R SET R-Score = 3 WHERE CustomerID IN (SELECT Top 25 Percent CustomerID FROM CUSTOMER_R WHERE R_Score IS null ORDER BY MostRecentOrderDate DESC); UPDATE CUSTOMER_R SET R-Score = 4 WHERE CustomerID IN (SELECT Top 50 Percent CustomerID FROM CUSTOMER_R WHERE R_Score IS null ORDER BY MostRecentOrderDate DESC); UPDATE CUSTOMER_R SET R-Score = 5 WHERE CustomerID IN (SELECT CustomerID FROM CUSTOMER_R WHERE R_Score IS null
Reporting Systems:Producing the RFM Analysis:RFM Results[SQL Server]
Reporting Systems:Report System Functions • Report Authoring: • Connect to data sources. • Create the report structure. • Format the report. • Report Management: • Defines who receives what reports when and by what means. • Report Delivery: • Push reports or allow them to be pulled.
Reporting Systems:OnLine Analytical Processing [OLAP] • An OLAP report has measures and dimensions: • Measure— A data item of interest. • Dimension— A characteristic of a measure. • OLAP cube— A presentation of a measure with associated dimensions. • An OLAP cube can have any number of axes. • The terms OLAP cube and OLAP report are synonymous. • OLAP allows drill-down— a further division of the data into more detail.
On-Line Analytical Processing (OLAP) • The use of a set of graphical tools that provides users with multidimensional views of their data and allows them to analyze the data using simple windowing techniques • Relational OLAP (ROLAP) • Traditional relational representation • Multidimensional OLAP (MOLAP) • Cube structure • OLAP Operations • Cube slicing – come up with 2-D view of data • Drill-down – going from summary to more detailed views
Summary report Drill-down Drill-down with color added Starting with summary data, users can obtain details for particular cells
Data Mining Applications • Data mining applications use sophisticated statistical and mathematical techniques to find patterns and relationships that can be used to classify and predict. • Unsupervised data mining— Statistical techniques are used to identify groups of entities with similar characteristics. • Cluster Analysis • Supervised data mining: • A model is developed. • Statistical techniques are used to estimate parameter values of the model. • Regression analysis
Data Mining Applications:Three Popular Data Mining Techniques • Decision tree analysis— Classifies entities into groups based on past history. • Logistic regression— Produces equations that offer probabilities that certain events will occur. • Neural Networks— Complex statistical prediction techniques
Data Mining Applications:Market Basket Analysis • Market Basket Analysis— Determines patterns of associated buying behavior. • Support— The probability that two items will be purchased together. • Confidence— The probability that an item will be purchased given the fact that the customer has already purchased another particular item. • Lift— the ratio of confidence to the basic probability that a particular item will be purchased.
Data Mining Applications:SQL Statements for Market Basket Analysis CREATE VIEW TwoItemBasket AS SELECT T1.ItemID as FirstItem, T2.ItemID as SecondIem FROM TRANS_DATA T1 JOIN TRANS_DATA T2 ON T1.TransactionID = T2.TransactionID AND T1.ItemID <> T2.ItemID; CREATE VIEW ItemSupport AS SELECT FirstItem, SecondItem, Count(*) AS SupportCount FROM TwoItemBasket GROUP BY FirstItem, SecondItem;