Download
1 / 23
230 likes | 343 Views
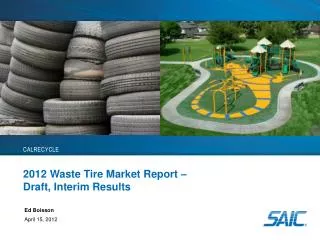
Insert Pictures Here. CalrecyclE. 2012 Waste Tire Market Report – Draft, Interim Results. Ed Boisson April 15, 2012. Outline. Methodology Key Findings and Trends (Draft) Market Development Implications. Methodology. Methodology. Interpreting Results – Things to Remember.

E N D
Insert Pictures Here • CalrecyclE 2012 Waste Tire Market Report – Draft, Interim Results Ed Boisson April 15, 2012
Outline • Methodology • Key Findings and Trends (Draft) • Market Development Implications
Interpreting Results – Things to Remember • CA Tire Use, Not Total Market Size • Documented Tire Flow, Not “Generation” • Generally +/- 10% Accuracy • RetreaderBuffings Not Counted • Metal, Fiber Not Counted in Diversion Rate • Today’s Results are Interim and Subject to Change
Civil Engineering Still Down Sharply Since 2010Rebound Expected in 2013 * Based on landfill surveys; not validated by CalRecycle
Exports Up Again; May Decline in 2013TDF Demand Strong; Shred/Bales Weak
Export Trends Influence Landfill Volumes* 2011 2012 2013 * Chart based on top 3 landfills receiving tires
Disposal Down to (Another) Record Low Million PTE
Market Development Observations • Supply Barriers Stabilizing Somewhat (For Now) • Tire Supply and Tip Fee Pressures Diminishing • TDA Supply Challenges if Demand Grows • Demand-Related Barriers Persisting • Government Agency Budget Constraints • Industry Concern over TDP Grant Reductions • Need to Raise Awareness and Document Benefits • Need to Promote TDPs Made w/CA Tires • Need for Expand TDP Specifications • Quality Standards, Best Management Practices
Market Development Observations (Continued) • Supply and Demand Reasonably Balanced, But • Market Demand Mixed • CA Crumb Production Capacity Flat • Some Pressure from Out-of-State Competitors • Bottom Line: • CA Producers Must be Well-Positioned • Still Cause for Caution in New Crumb Rubber Investments • Spector of Large Volume Pyrolysis? • When Will Export Volatility Return?
Imports • Crumb Rubber Imported From: • Utah • British Columbia • Mid-West • Germany • Texas Plant Coming – 10 Million PTE/Yr? • TDP Import Pressure: • RAC (Terminal Blend), Turf, Mulch/Playgrounds • Tiles, Mats • Others?
2012 CA Tire Diversion Rate: 92.4%Is the Glass Half-Empty or Half-Full? 40.6% 51.8%
Q&A and Comments Send written comments by April 23 to Sally.French@CalRecycle.ca.gov Please insert in the subject line of the e-mail “Comments on Tire Market Analysis Presentation”. Draft report expected to be released in May with a comment period. Final report expected to be published in June.