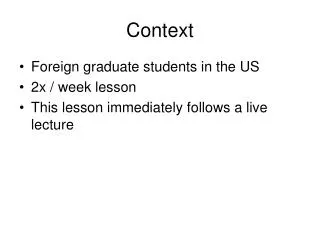
Context
Context. f n. Stock Data. Market Data. 0. Price. Industry Groups. Fundamentals. Beta K Price. Beta K Price. Pass 1

Context
E N D
Presentation Transcript
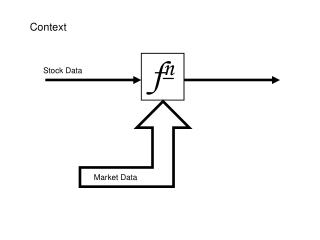
Context fn Stock Data Market Data
Price Industry Groups Fundamentals
Beta K Price
Beta K Price
Pass 1 Collect historical volatility levels of each stock, sort stocks into bins Pass 2 Calculate mean daily price change for stocks in each bin Pass 3 Calculate two separate means price changes, one for above mean and one for below Return Final Calculation Construct piecewise linear approximation of daily price change per volatility Increasing Historical Volatility
+1 Return 0 -1 Increasing Historical Volatility
0.180 GE - adjust R param 0.090 0.00435257 0.000 -0.00060 -0.00783725 -0.090 -0.180 Created with AmiBroker - advanced charting and technical analysis software. http://www.amibroker.com
0.180 GE - adjust R param 0.090 0.00611642 0.000 -0.00806698 -0.0224485 -0.090 -0.180 Created with AmiBroker - advanced charting and technical analysis software. http://www.amibroker.com
0.180 GE - adjust R param 0.090 0.0125319 0.000 -0.00839436 -0.0297501 -0.090 -0.180 Created with AmiBroker - advanced charting and technical analysis software. http://www.amibroker.com
0.180 GE - adjust R param 0.090 0.0217459 0.000 -0.00650727 -0.0334761 -0.090 -0.180 Created with AmiBroker - advanced charting and technical analysis software. http://www.amibroker.com
0.180 GE - adjust R param 0.090 0.0340311 0.000 -0.00399114 -0.0384442 -0.090 -0.180 Created with AmiBroker - advanced charting and technical analysis software. http://www.amibroker.com
0.180 GE - adjust R param 0.090 0.0493876 0.000 -0.00085 -0.0446542 -0.090 -0.180 Created with AmiBroker - advanced charting and technical analysis software. http://www.amibroker.com
0.180 GE - adjust R param 0.090 0.0647441 0.00229917 0.000 -0.0508642 -0.090 -0.180 Created with AmiBroker - advanced charting and technical analysis software. http://www.amibroker.com
0.180 GE - adjust R param 0.0923858 0.090 0.00796045 0.000 -0.0620423 -0.090 -0.180 Created with AmiBroker - advanced charting and technical analysis software. http://www.amibroker.com
Conclusions IFTA ‘05 ~FIN~