Download

1 / 4
40 likes | 115 Views
Explore ecological data trends from NSF's Agrarian Lands in Transition sites and predict future cattle numbers in Kansas for 2080. Examine forest vs. cleared land changes, population trends, and usage of cattle in agriculture.

E N D
Printed with permission from the following National Science Foundation Long Term Ecological Research sites involved in the Agrarian Lands in Transition (http://ces.asu.edu/agtrans/) grant (#DEB-0216560): CAP, CWT, HFR, KBS, KNZ, SGS Data:How to Read It How to Use It Data:How to Read It How to Use It 2
Printed with permission from the following National Science Foundation Long Term Ecological Research sites involved in the Agrarian Lands in Transition (http://ces.asu.edu/agtrans/) grant (#DEB-0216560): CAP, CWT, HFR, KBS, KNZ, SGS Evaluate the maps and graph of Coweeta in North Carolina. What happened to the forest land versus the cleared land? What is happening with the population?
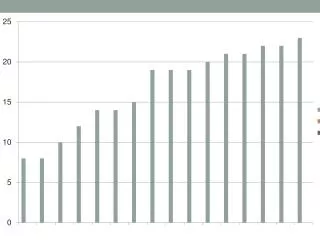
Printed with permission from the following National Science Foundation Long Term Ecological Research sites involved in the Agrarian Lands in Transition (http://ces.asu.edu/agtrans/) grant (#DEB-0216560): CAP, CWT, HFR, KBS, KNZ, SGS Cattle are a huge part of agriculture in Kansas. In 1880 cattle numbers ranged from 426 to 26,208 per area (with some areas missing data). In 2000 numbers increased from 3,000 to 285,000 cattle per area. Evaluate the data provided through these maps. Determine whether you think the maps are easy to read or not. Summarize why you believe the maps are easy to read or what improvements could be made to make the maps more readable.
Printed with permission from the following National Science Foundation Long Term Ecological Research sites involved in the Agrarian Lands in Transition (http://ces.asu.edu/agtrans/) grant (#DEB-0216560): CAP, CWT, HFR, KBS, KNZ, SGS Evaluate the data and construct a map demonstrating your prediction for the amount of cattle that will be found in Kansas in 2080.