Download
1 / 31
320 likes | 483 Views
This presentation offers an introduction to the role of molecular markers in carrot breeding, focusing on the fundamental aspects of plant cells, DNA structure, and the processes of cell division. It covers techniques such as PCR (Polymerase Chain Reaction) for amplifying DNA, and demonstrates how molecular markers can be utilized to map traits and enhance breeding efficiency. By utilizing molecular markers, breeders can identify and select desirable traits at any plant growth stage, ultimately leading to improved carrot varieties.

E N D
Carrots and Genomics An Introduction to the application of Molecular Markers
Outline of presentation • General introduction • The plant cell • DNA • Celldivision, production of gametes • PCR • Molecular Markers • Application in carrotbreeding
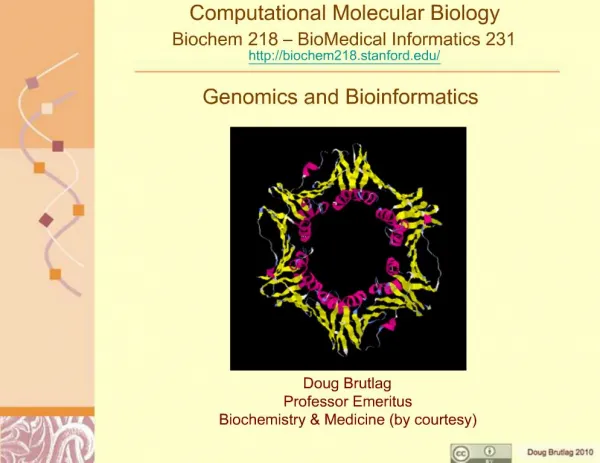
The plant cell Cell wall Cell membrane Cytoplasm Mitochondrion Vacuole Nucleus nuclear DNA (Chloroplast)
Nucleus with DNA 2n = 18 Total size carrot genome: 473 Mbp
The plant • Within a plant, all plant cells contain the same DNA • For plant growth, cells need to divide • Prior to cell division → DNA duplication
DNA duplication Double stranded DNA Separation of two strands Incorporation of nucleotides Two copies of double stranded DNA
Cell Division DNA duplication Mitosis 2 identical diploïd cells
Production of gametes DNA duplication Meiosis 4 unique haploïd gametes
Summary • A plant consists of many different cells, each with identical DNA content • DNA consists of two complementary strands • During duplication, each strand acts as a template to produce two identical copies • Duplication of DNA occurs prior to: • Cell division → two identical diploïd cells • Gamete production → four unique haploïd cells
PCR • Polymerase Chain Reaction • Amplification of DNA • Mimics the process of DNA duplication in the plant • The polymerase (enzyme) requires dsDNA to start building in nucleotides
PCR denaturation annealing elongation
PCR 1st cycle —› 2nd cycle —› 3rd cycle —› 4th cycle ‒ ‒ – —› 30th cycle 230 ~ 1 billion copies 21 = 2 copies 22 = 4 copies 23 = 8 copies 24 = 16 copies PCR: amplification of a specificregion of the genomedefinedby the sequence of the primers used in the reaction
Molecular Markers • Amplify a specificregion of the genomethrough PCR • Visualize the amplified fragment • Performthis step for different parentlines • Whenanamplified fragment is different fortwoparentlinesitbecomes a molecular marker
Molecular Markers A BM 600 bp M is a molecular size marker 500 bp 400 bp 300 bp 200 bp 100 bp
Molecular Markers Testing the % of inbreds in a hybrid seedlot (example from cabbage) A B M Individual seedlings from a hybrid seedlot
Molecular Markers: SNP • Single Nucleotide Polymorphism • Sequence information from multiple parent lines • SNP discovery:
Molecular Markers: SNP 384 SNPs 192 samples per day
Applications in carrot breeding Mapping a trait
Mapping a trait • Create a population segregating for your trait (~250 individuals) • Genotype the population • Phenotype the population • Combine these data to find the location of your trait on the genome
Mapping a trait A B F1 Crossing X Selfing (plant forms gametes)
Producing gametes DNA duplication Meiosis 4 unique gametes
Mapping a trait A B F1 Crossing X Selfing F1S1 population
Mapping a trait Genotyping b h h h h a a h h b b a b h b h a h b h b h h a h h h b h a b h b h a h h h b a h a b b h b h h b h h h a h a h h a h h b b h h h h b b a h a a a b h a h h b h h a a b b b a b a a a b a a h b b h b a a b h h a b a h
Mapping a trait Phenotyping r r s r r r s r r s r r s r s r r r
Mapping a trait Combining data b h h h h a a h h b b a b h b h a h b h b h h a h h h b h a b h b h a h r r s r r r s r r s r r s r s r r r h h b a h a b b h b h h b h h h a h a h h a h h b b h h h h b b a h a a a b h a h h b h h a a b b b a b a a a b a a h b b h b a a b h h a b a h
Mapping a trait Combining data b h b h h a h h h b h a b h b h a h h h b h h a b h h b h h b h b h a h r r s r r r s r r s r r s r s r r r h h b h h a b h h b h h b h b h a h h h b a h a b b h b h h b h h h a h
Mapping a trait • Errors in scoring make the analysis more complex • Better phenotyping results in better mapping • Easy for traits determined by a single gene: one locus on the genome
Mapping a trait • For complex traits use QTL mapping • QTLs: Quantative Trait Loci • Genotyping and phenotyping a population • Use computer software to statistically calculate the positions on the genome (loci) that have an influence on the trait.
Advantages for carrot breeding • Dominant resistance: markers can distinguish homozygous and heterozygous resistant plants • Recessive resistance: markers can distinguish heterozygous and homozygous susceptible plants • Combine resistance genes
Advantages for carrot breeding • Molecularmarkers provideanadditional tool forbreedersto select fortheirtraits of interest. • Selectionwith markers canbedone at any stage withany part of the plant • New possibilitiesto combine traits of interest tocreate even bettercarrots