Download
1 / 5
50 likes | 86 Views
This proposed model explores the transient induction of systemic induced resistance in red pine trees, addressing the declining resistance to challenges such as bark beetle attacks. It defines the point of no return where tree damage from induction events becomes intolerable. The study presents how trees become symptomatic when induced susceptibility surpasses constitutive resistance. The research analyzes induction events, constitutive resistance, time, induced susceptibility, and mortality pockets in red pine trees through transect studies in Wisconsin. The schematic diagram illustrates the SIR model overlaid on red pine mortality pockets, indicating the relationship between resistance and root infection by Leptographium terebrantis. The study presents HPLC chromatograms of crude bark extracts showing control and pathogen peaks.

E N D
Transient induction of systemic induced resistance against fungal pathogens in red pine Alieta Eyles and Enrico Bonello
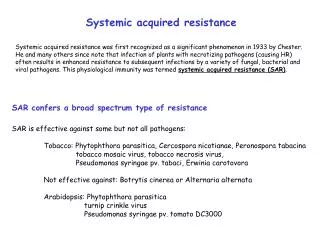
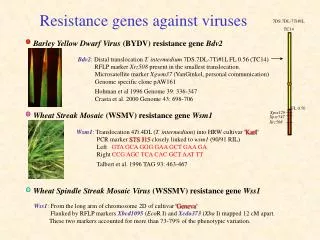
Proposed model of induced systemic resistance Declining resistance to challenge, e.g. bark beetle attack Resistance Baseline, constitutive resistance Point of no return: damage from induction event can no longer be tolerated by the tree Tree becomes symptomatic Induced susceptibility Time Induced resistance Induction event Constitutive resistance
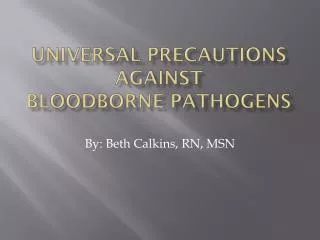
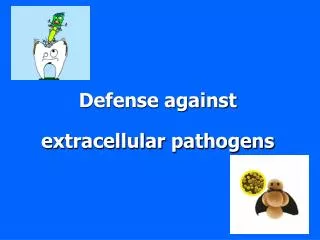
Time Induced susceptibility SIR 6 5 4 3 2 1 Transect 60 Mortality pocket Infection of root system with L. terebrantis (%) 0 10 0 Distance from pocket margin (m) Figure XX. Schematic representation of test for the SIR hypothesis in Wisconsin. The SIR model (upper half of the diagram) is superimposed on a red pine mortality pocket. The transect shows six sampling points moving away from the pocket margin. The lower half of the diagram illustrates the known rate of root infection by Leptographium terebrantis (Erbilgin and Raffa 2003, 2003). Positioning of transect and relationship between resistance and actual root infection rates are speculative and intended for illustrative purposes only.
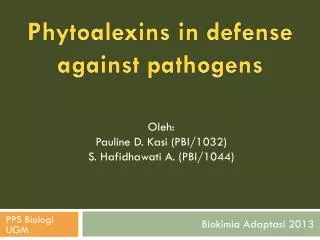
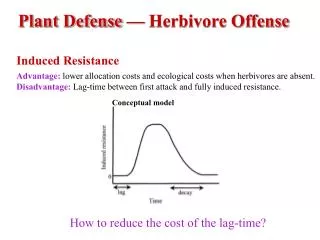
HPLC chromatogram of crude bark extracts: Control Ophiostoma Leptographium Peak 7 Peak 4
Peak 4 Peak 7