Download
1 / 22
220 likes | 251 Views
Review of global water distribution and usage trends, impacts of climate change, waterborne illnesses, pollution types, and drinking water quality control. Explore Cincinnati's water sources and treatment processes. Detailed insights and prevention methods provided.

E N D
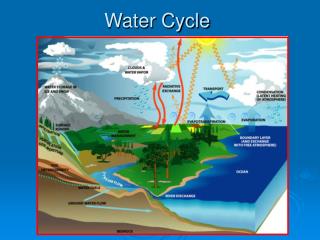
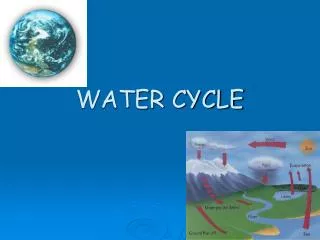
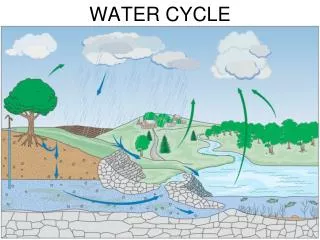
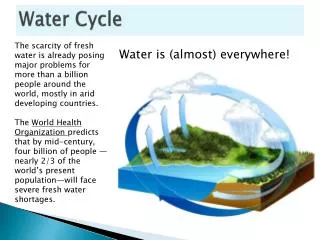
Global Distribution of Water • Quantity and Quality • Demonstration activity
Water Uses • Domestic • Agricultural • Industrial • Power generation (dams are not counted as withdrawal)
No stress Low stress Mid stress High stress Very high stress No data available Water stress indicator: Withdrawal to Availability ratio (2003)* Water withdrawal = water used for irrigation, livestock, domestic and industrial purposes (2000) Water availability = average annual water availability based on 1961-1990 * From IPCC 2007 Freshwater Resources
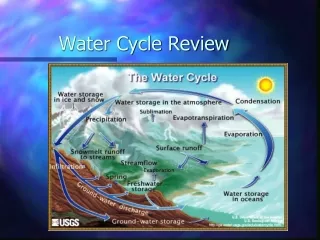
USGS Trends in Water Use 1950-2000Withdrawals Total withdrawals increased steadily from 1950 to 1980, declined more than 9 percent from 1980 to 1985, and have varied less than 3 percent between the 5-year intervals since 1985. Total withdrawals peaked during 1980, although total U.S. population has increased steadily since 1950. Total withdrawals for 2000 were similar to the 1990 total withdrawals, although population had increased 13 percent since 1990.
(U.S. Geological Survey, 1984; updated using 1995 estimates of water use) http://water.usgs.gov/watuse/misc/consuse-renewable.html
Potential Effects of Global Warming* • Results of increases in temperature (More than one-sixth of the world’s population live in glacier- or snowmelt-fed river basins) • Sea level rise (saltwater intrusion?) • Changes in precipitation • Semi-arid and arid areas are particularly exposed to the impacts of climate change on freshwater • Higher water temperatures, increased precipitation intensity, and longer periods of low flows exacerbate many forms of water pollution, with impacts on ecosystems, human health, water system reliability and operating costs * Freshwater resources and their management; Climate Change 2007: Impacts, Adaptation and Vulnerability. Contribution of Working Group II to the Fourth Assessment Report of the Intergovernmental Panel on Climate Change (IPCC 2007 )
Figure TS.5. Illustrative map of future climate change impacts on freshwater which are a threat to the sustainable development of the affected regions. Background shows ensemble mean change of annual runoff, in percent, between the present (1981-2000) and 2081-2100 for the SRES A1B emissions scenario; blue denotes increased runoff, red denotes decreased runoff. Underlying map from Nohara et al. (2006) [F3.8].
Waterborne Illnesses • What are some common waterborne illnesses? • How do we detect their likelihood? • How can we prevent them?
Water Pollution • Types of Pollutants • Organic (living and nonliving) • Inorganic • Thermal • Sources of Pollutants • Point • Nonpoint • USEPA Water Pollution Control Regulations
Drinking Water Quality • USEPA Drinking Water Regulations • Coliform bacteria • Turbidity • Organic and inorganic chemicals • Radionuclides
Pesticides in Drinking Water • How do they get there? • What happens when we drink them? • What happens if they react with the most common disinfectant used for drinking water in the US?
Sourcewater Protection • Groundwater (Aquifer) recharge zones • Surface water pollution
Cincinnati Drinking Water Sources • Two supplies: • surface water from the Ohio River (88%) • groundwater from ten wells in the Great Miami Aquifer (12%) • Slightly different treatment at each plant • Why?
Great Miami Buried Valley Aquifer Magnified View of Sand and Gravel Aquifer Groundwater fills the open pockets lying between individual sand and gravel particles. The larger the interconnected air spaces (i.e., the greater the porosity) the more rapidly groundwater will move through the aquifer
Teays River Destroyed by glaciers of Pleistocene Ice Age 2 million years ago
Cincinnati Water Balance • Stormwater management • Combined sewer overflows
Common Treatment Steps • Coagulation • Filtration • Disinfection
Other methods • Activated carbon • Ion exchange/chemical precipitation • Membranes • Air stripping (then comes distribution)
Greater Cincinnati Water Works • Major Treatment Processes: • Settling (coagulation, flocculation) • Filtration • Disinfection