Ecological Competition Dynamics and Coexistence Strategies
180 likes | 266 Views
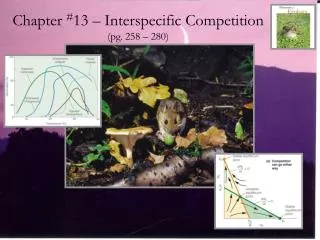
Explore interspecific competition and population interactions through the logistic and Lotka/Volterra models. Discover the implications of competition coefficients and isocline modeling, leading to insights on species growth and coexistence strategies. Delve into outcomes of competitive scenarios and the concept of diffuse competition.

Ecological Competition Dynamics and Coexistence Strategies
E N D
Presentation Transcript
# individuals Time Logistic Curve
Logistic model • Logistic equation • dN/dt = rN((K-N)/K) • Assumptions of the logistic model: • Each individual has identical ecological properties • Instantaneous response to environmental change • Constant upper limit to population size and rate of gain is directly related to remaining gap • Limited space and constant food supply • Age distribution is stable
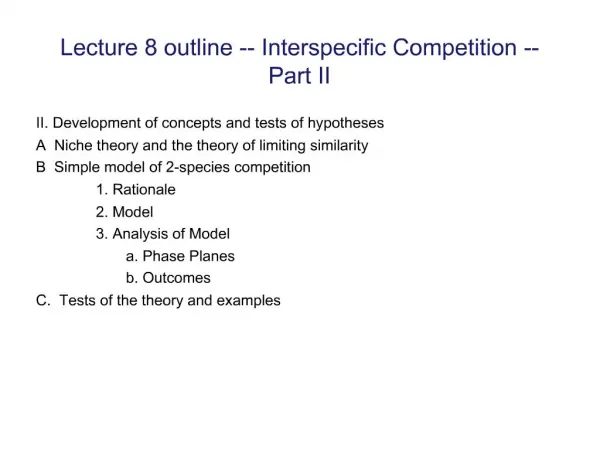
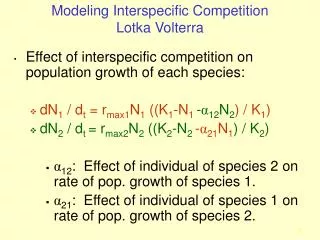
Lotka/Volterra model • dN1/dt = r1N1[(K1-N1- 12N2)/K1] • is the competition coefficient • 12 is effect of species 2 on species 1 • dN2/dt = r2N2[(K2-N2- 21N1)/K2] • if 12 >1, then individuals of sp. 2 have a greater inhibitory effect on individuals of sp. 1 than does species 1 on species 1. • if 12 <1, then sp. 2 individuals have less effect
Lotka/Volterra assumptions • Environment is homogeneous and stable • Migration is unimportant • Coexistence requires a stable equilibrium point • Competition is the only important biological interaction
Model with isocline Growth is 0 along the line See Fig. 12.1 and 12.2 Species 1 growth Species 2 growth
Finding K/ • dN1/dt = r1N1[(K1-N1- 12N2)/K1 • if growth is 0, and r is >0, then the term (K1-N1- 12N2) must be 0 • therefore N1 = K1 - 12N2 • when N1 = 0, N2 = K1/12
Possible outcomes Fig. 12.3
Possible outcomes Fig. 12.3
Diffuse competition • Effect of several species
Diffuse competition • Effect of several species • Exclusion may occur
How does coexistance occur? • Unpredictable gaps: the poorer competitor is a better colonizer • Unpredictable gaps: the pre-emption of space • Fluctuating environments • Ephemeral patches with variable life-spans • Aggregated distributions
If we observe niche differences in the field, what does it mean? • Current competition • Evolutionary avoidance through competition • Evolutionary avoidance (without competition)
DeWitt diagrams • Plants sown at different densities (40:0, 30:10, 20:20, 10:30, 0:40) • Seeds harvested