Motion Study Guide: Understanding Slope in Physical Science
This motion study guide covers the fundamentals of slope in distance-time and velocity-time graphs, essential for understanding motion in Physical Science. The slope indicates how distance or speed changes with time, highlighting concepts like acceleration. The guide includes calculations for various scenarios, such as determining speeds from distances traveled and times taken for different objects. Practical examples like a rocket and a race car help illustrate these principles effectively.

Motion Study Guide: Understanding Slope in Physical Science
E N D
Presentation Transcript
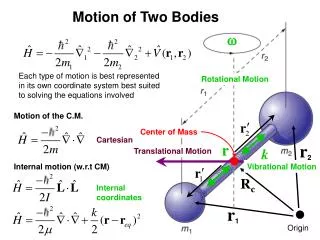
Motion Study Guide & Notes Mr. Rosato’s Honors Physical Science Fall 2013
Slope of a Curve Slope shows how much y changes with x Y Y Slope = 3/2 X X
Reading a Velocity-Time (VT) Graph • The slope of a VT graph shows how fast the speed is changing – or how the object is accelerating
A rocket can move 100 kilometers in 4 seconds. What speed is it moving at? • What speed (in m/s) is a skateboarder moving if he can skate 10 kilometers in 10 minutes? • A red Ferrari zooms over 500 metres in 4 seconds. What is its speed? • How long would it take a snail to slither 20 meters at 5 meters per hour? • How many seconds does it take an Indy race car to travel a 240 meter straight section at 80 m/s?
1. How fast is a bird flying if it goes 50 meters in 5 seconds ? 2. If a lizard crawls 10 meters in 20 seconds, what is its speed? 3. If a fish swims a distance of 4 km in 2 hours, what is its speed? 4. If a baseball is traveling at 60 m/s, how far will it go in 3 seconds? 5. How much time will it take a bike going 5 m/s to travel 20 meters ? 6. If a sprinter runs 40 meters in 5 seconds what is his speed? 7. If an insect travels for 300 seconds at a speed of 2 cm/second, how far will it have traveled?