Download
1 / 12
120 likes | 144 Views
Learn about hypothesis testing, confidence intervals, Type I and II errors, sample size determination, and population proportion inference with practical examples and detailed explanations.

E N D
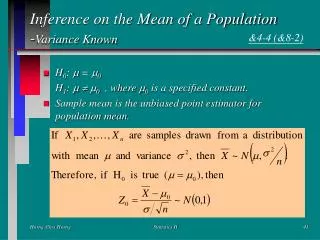
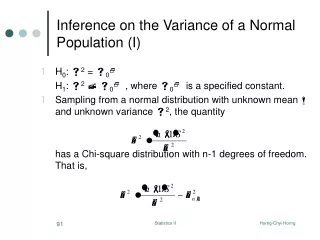
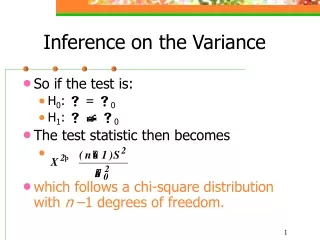
Inference on the Variance • So if the test is: • H0: = 0 • H1: 0 • The test statistic then becomes • which follows a chi-square distribution with n –1 degrees of freedom.
Rejection region for the 2-test • For a two-tailed test: • Reject if 2 > 2/2,n–1 or 2 < 2 1–/2,n–1 • For an upper-tail test: • Reject if 2 > 2,n–1 • For an lower-tail test: • Reject if 2 < 2 1-, n–1
Example: Jen and Barry’s • Jen and Barry’s uses an automatic machine to box their ice-cream. A sampling of 20 containers results in a sample variance of 0.0153. If the variance of fill volume exceeds 0.01, an unacceptable proportion of containers will be under- and over-filled. Is there evidence to suggest that there is a problem at the 5% level?
Type II Error in a 2-test • To look up the characteristic curves for the chi-square test, we need • The abscissa parameter
Example: Jen and Barry’s • If the variance exceeds 0.01, too many containers will be underfilled. You are given the null hypothesis is that the standard deviation is 0.1. Suppose that if the true standard deviation exceeds this value by 25%, and we would like to detect this w.p. at least 0.8. Is a sample size of 20 adequate?
Confidence Intervals • The 100(1 – )% CI on is given by • What are the corresponding lower or upper confidence limits?
Inference on a Population Proportion • H0: p = p0 • H1: p p0 • Test statistic • Reject H0 if z0>z/2 or z0< -z/2
Example • A semiconductor manufacturer produces controllers used in automobile engine applications. The customer requires that the fraction of defective controllers be less than 0.05 and that the latter be demonstrated using = 0.05. The manufacturer takes a random sample of 200 devices and finds 4 defective. Will this result satisfy the customer?
Confidence interval on a proportion • If is the proportion of observations in a random sample of size n that belongs to a class of interest, then an approximate 100(1-) percent confidence interval on the proportion p of the population that belongs to this class is where z/2 is the upper /2 percentage point of the standard normal distribution.
Sample size choice • Sample size necessary to be 100(1- ) % confident that the error does not exceed E: • or, if the estimate of p in unavailable:
Example • In a random sample of 85 engine crankshaft bearings, 10 have a surface finish that is rougher than needed. • Find a 95% CI for the the proportion of “bad” bearings. • How large a sample is needed if we want to be 95% confident that the error in the estimation of p does not exceed 0.05?