Download
1 / 25
250 likes | 398 Views
Analysis of variance and statistical inference. R epetitive designs. I n medical research we test patients before and after medical treatment to infer the influence of the therapy.

E N D
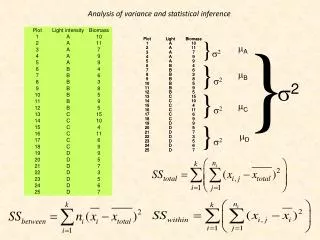
Repetitive designs In medical research we test patients before and after medical treatment to infer the influence of the therapy. We have to divide the total variance (SStotal) in a part that contains the variance between patients (SSbetween) and within the patient (SSwithin). The latter can be divided in a part that comes from the treatment (SStreat) and the error (SSerror) Medical treatment
SpidersfromtwoMazuarianlakeensembles Summarystatistics
Startinghyotheses • Thedegree of disturbance (humanimpact) influencesspeciesrichenss. • Speciesrichness and abundancedepends on islandarea and environmentalafctors. • Island ensemblesdifferinspeciesrichness and abundance. • Area, abundance, and speciesrichnessarenon-linearlyrelated. • Latitude and longitude do not influence speciesrichness. Sorting • Area, abundance, and speciesrichnessarenon-linearlyrelated. • Latitude and longitude do not influence speciesrichness. • Speciesrichness and abundancedepends on islandarea and environmentalfactors. • Island ensemblesdifferinspeciesrichness and abundance. • Thedegree of disturbance (humanimpact) influencesspeciesrichenss. Thehypothesesare not independent. Eachhypothesisinfluencesthewayhow to treatthenext.
Area, abundance, and speciesrichnessarenon-linearlyrelated. Species – area and individualsarearelationships
Latitude and longitude do not influence speciesrichness. Doesthedistancebetweenislands influence speciesrichness? Aregeographically near islandsalsosimilarinspeciesrichnessirrespective of islandarea? Isspeciesrichnesscorrelatedwithlongitude and latitude? R(S-Long) = 0.22 n.s. R(S-Lat) = 0.28 n.s.) Spatialautocorrelation Thatthereis no significantcorrelationdoes not meanthatlatitude and longitude do not have an influence on theregression model withenvironmentalvariables. S2 S1 S3 S4 S5 S6 In spatialautocorrelationthedistancebetweenstudysites influence theresponse (dependent) variable. Spatialyadjacentsitesarethenexpected to be moresimilarwithrespect to theresponsevariable.
Moran’s I as a measure of spatialautocorrelation Moran’s I is similar to a correlation coefficient all applied to pairwise cells of a spatial matrix. It differs by weighting the covariance to account for spatial non-independence of cells with respect to distance. S2 S1 S3 S4 S5 S6 If cell values were randomly distributed (not spatially autocorrelated) the expected I is Statisticalsignificanceiscalculatedfrom a Monte Carlo simulation All combinations of sites
Individuals/trap isslightlyspatiallyautocorrelated Latitude and longitudeslightly influence speciesrichenss. Eventhisweakeffectmight influence theoutcome of a regressionanalysis.
Log transformedvariables Akaikeinformationcriterion. Thelower AIC themoreappropriateisthe model Spatialautoregressionresult Errors: Too many variables!! Solution: priorfactoranalysis to reducethenumber of dependent variables OLS result Stepwsievariablereduction
Informationcriteria Whatfunctionfitsbest? Themorefreeparameters a model hasthehigher will be R2. Themoreparsimonious a model isthelesseristhebiastowardstype I errors. Explainedvariance Bias Theoptimalnumber of model parameters We have to find a compromisbetweengoodness of fit and bias! many few Model parameters
TheAkaikecriterion of model choice k: number of model parameters L: maximumlikelihoodestimate of the model Thepreferred model isthe one withthelowest AIC. Iftheparametererrorsarenormal and independent we get n: number data points RSS: residualsums of squares If we fit using R2: If we fit usingc2: Atsmallsamplesize we shouldusethefollowingcorrection
We getthesurprisingresultthattheseeminglyworstfitting model appears to be thepreferred one. A single outliermakesthedifference. The single high residualmakestheexponentialfittingworse
Significantdifferencein model fit ApproximatelyDAIC isstatisticalysignificantinfavor of the model withthesmaller AIC atthe 5% errorbenchmarkif |DAIC| > 2. Thelast model issignificantly (5% level) thebest.
Stepwisevariableelimination Highlycorrelatedvariablesessentiallycontainthe same information. Correlations of less than 0.7 can be tolerated. Hencecheck first thematrix of correlationcoefficients. Eliminatevariablesthat do not addinformation. Standardizedcoefficients (b-values) areequivalents of correlationcoefficients. Theyshouldhavevaluesabove 1. Suchvalues point to too high correlationbetweenthepredictorvariables (collinearity). Collnearitydisturbsanyregression model and has to be eliminatedprior to analysis.
Thefinal model Simple test wiseprobabilitylevels. We yethave to correct for multipletesting. Thebest model is not alwaysthe one withthelowest AIC orthehighest R2. Bonferronicorrection To get an experimentwiseerrorrate of 0.05 our test wiseerrorrateshave be less than 0.05/n Speciesrichnessispositivelycorrelatedwithislandarea and negativelywithsoilhumidity.
Island ensemblesdifferinspeciesrichness and abundance. A simple ANOVA does not detectanydifference Speciesrichnessdepends on environmentalfactorsthatmaydifferbetweenislandensembles. Analysis of covariance (ANCOVA)
Analysis of covariance (ANCOVA) ANCOVA isthecombination of multipleregression and analysis of variance. First we perform a regressionanlyis and usetheresiduals of thefull model as entriesinthe ANOVA. ANCOVA isthe ANOVA on regressionresiduals. Themetricallyscaledvariablesserve as covariates. Siteswithvery high positiveresidualsareparticularlyspeciesrichevenafter controlling for environmentalfactors. Theseareecological hot spots. Regressionanalysisserves to identifysuch hot spots We usetheregressionresiduals for furtheranalysis
ANCOVA Speciesrichnessdoes not differbetweenislandensembles.
Thedegree of disturbance (humanimpact) influencesspeciesrichenss. Speciesrichness of spiders on lakeislandsappears to be independent of thedegree of disturbance
Howdoesabundancedepend on environmentalfatcors? The ful model and stepwisevariableelimination All coefficientsarehighlysignificant! All standardizedcoefficientsareabove 1. Thispoints to too high collinearity We furthreliminateuninformativevariables. Abundancedoes not significallydepend on environmentalvariables
Howdoesabundancedepend on thedegree of disturbance? Abundance of spiders on lakeislandsappears to be independent of thedegree of disturbance


