Download
1 / 24
290 likes | 603 Views
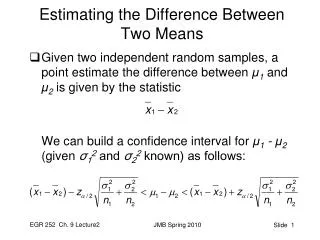
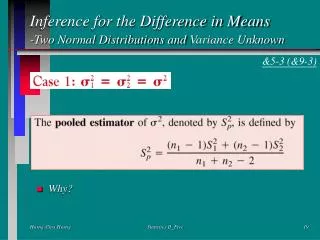
Inference for the Difference in Means -Two Normal Distributions and Variance Unknown. &5-3 (&9-3). Why?. Replacing s by S p , we have.

E N D
Inference for the Difference in Means-Two Normal Distributions andVariance Unknown &5-3 (&9-3) • Why? Statistics II_Five
Replacing s by Sp, we have Statistics II_Five
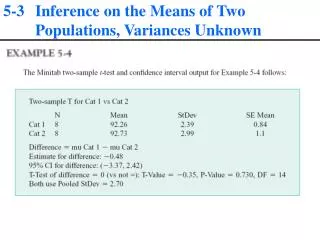
Example 9-5Two catalysts are being analyzed to determine how they affect the mean yield of a chemical process. Specially, catalyst 1 is currently in use, but catalyst 2 is acceptable. Since catalyst 2 is cheaper, it should be adopted, providing it does not change the process yield. A test is run in the pilot plant and results in the data shown in Table 9-2. Is there any difference between the mean yields? Use a = 0.05 and assume equal variances. Statistics II_Five
Table 9-2 Catalyst Yield Data, Example 9-5 Statistics II_Five
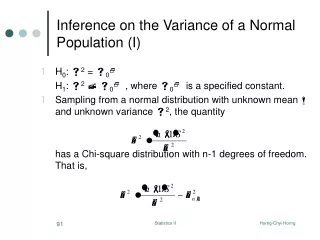
is distributed approximately as t with degrees of freedom given by Statistics II_Five
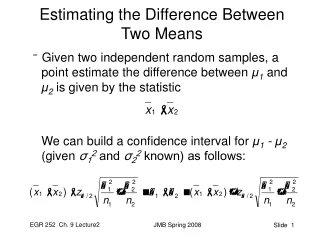
C.I. on the Difference in Means Statistics II_Five
C.I. on the Difference in Means Statistics II_Five
Paired t-Test &5-4 (&9-4) • When the observations on the two populations of interest are collected in pairs. • Let (X11, X21), (X12, X22), …, (X1n, X2n) be a set of n paired observations, in which X1j~(m1, s12) and X2j~(m2, s22) and Dj = X1j – X2j, j = 1, 2, …, n. Then, to test H0: m1= m2 is the same as performing a one-sample t-test H0: mD = 0 since mD = E(X1-X2) = E(X1)-E(X2) = m1 - m2 Statistics II_Five
Example 9-9 An article in the Journal of Strain Analysis compares several methods for predicting the shear strength for steel plate girders. Data for two of these methods are shown in Table below. We wish to determine whether there is any difference between the two methods. Statistics II_Five
Paired Vs. Unpaired • If the experimental units are relatively homogeneous (small s) and the correlation within pairs is small, the gain in precision attributable to pairing will be offset by the loss of degrees of freedom, so an independent-sample experiment should be used. • If the experimental units are relatively heterogeneous (large s) and there is large positive correlation within pairs, the paired experiment should be used. Typically, this case occurs when the experimental units are the same for both treatments; as in Example 9-9, the same girders were used to test the two methods. Statistics II_Five
A Confidence Interval for mD Statistics II_Five
Table 9-5 Time in Seconds to Parallel Park Two Automobiles Statistics II_Five