Download

1 / 24
240 likes | 304 Views
Gain insights from the SCEM Telebriefing on Semiconductor Manufacturing featuring major forecast changes, global economic scenarios, revenue growth scores, and production forecasts. Understand the positive outlook, market uncertainties, and supply side trends in the semiconductor industry for 2003.

E N D
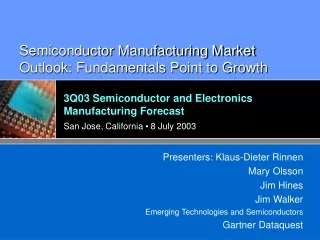
research consulting measurement community news Semiconductor Manufacturing:Positive Growth in 2003 SCEM Telebriefing 18 December 2002 Host: Klaus-Dieter Rinnen Speakers: Dean Freeman Jim Hines Jim Walker
Major Forecast Changes Since Midyear • Semiconductor revenue forecast still positive for 2002 — units up 14%; for 2003, expect 12% revenue growth • 2002: Capital spending and equipment growth forecasts • -37% for Capital Spending • -33% for WFE • -23% for P&A Equipment • 2003: Capital spending and equipment growth forecasts • 15% for Capital Spending • 16% for WFE • 25% for P&A Equipment • Next build cycle for new fabs delayed six months to 1H04 • Next downcycle delayed up to nine months to early 2006
Forecast Growth Scorecard Revenue Growth (%)2002 2003 Up Base Down Up Base Down World GDP +1.8 +2.8 U.S. GDP +2.4 +2.9 E Equipment* +1 +6 Semiconductor +2 +1 -1 +21 +12 -9 Capital Spending -34 -37 -38 +25 +15 -2 Equip. Spending -31 -32 -32 +30 +17 +4 WFE Equipment -32 -33 -33 +28 +16 +3 P&A Equipment -21 -23 -24 +41 +25 +14 Silicon (MSI) +19 +5 *Production revenue
Global Economy Is Struggling Uncertainty Brings Volatility • United States is slowly recovering. • Recoveries in Europe and Japan have stalled. • Asia/Pacific has experienced a healthy rebound. • Japan is starting to invest again. • Middle East uncertainties are casting a pall over global markets. • A global deflationary threat is growing. • The interplay of confidence and economic policy will shape the recovery dynamic. • High degree of risk and uncertainty will tilt the economic outlook to a more protracted recovery; expect continued market volatility.
Quarterly U.S. GDP Growth — November 2002:Slower Outlook Anticipated U.S. GDP Growth (Percent SAAR) 6 5 4 3 Revised Actual! 2 Forecast 1 0 -1 -2 -3 2Q00 3Q00 4Q00 1Q02 2Q02 3Q02 1Q01 2Q01 3Q01 4Q01 4Q02 1Q03 2Q03 Source: Global Insight and Gartner Dataquest
Global GDP Growth Scenarios, 2000-2004 Optimistic, p=10% Rising Confidence Strong Policy Stimulus Real GDP Growth 5 4 +4.0 +3.9 +3.7 Most Likely, p=55% 3 +3.1 +2.8 +2.9 2 +2.0 +1.8 +1.8 +1.6 Falling Confidence Weak Policy Stimulus Pessimistic, p=30% 1 +1.1 0 2000 2001 2002 2003 2004 Source: Global Insight (December 2002)
Electronic Equipment Production: Phased Recovery Under Way 2H02 1H03 2H03 1H04 Spending ConsumerCorporate Cellular Phones PCs Communications
Quarterly Semiconductor Revenue: Uncertainty Reigns 2003 Market Scenarios (Probability) Optimistic Most Likely Pessimistic 2002 2.4% 1.4% -1.4% 2003 +21% +12% -9% Billions of U.S. Dollars 65 60 55 50 45 40 35 30 4Q98 2Q99 4Q99 2Q00 4Q00 2Q01 4Q01 2Q02 4Q02 2Q03 4Q03 Optimistic Pessimistic Most Likely
Semiconductor Revenue Forecast Billions of U.S. Dollars 300 19% -2% 250 26% 200 12% 1% 150 100 50 0 1998 2000 2002 2005 2006 1993 1994 1995 1996 1997 1999 2001 2003 2004 Source: Gartner Dataquest (November 2002)
Supply Side: Positive Outlook After Years of Decline • Two years of steep declines in CAPEX have limited excess capacity. • 2002 CAPEX lower than 1998 CAPEX • 2001-2002 capacity additions 15% of 1999-2000 additions • 20% over-investment at end of 2000, 14% under-investment at end of 2002 • More than 100 fab closures between 2000 and 2003 have weeded out old excess capacity — 10% of total. • Leading-edge utilization was greater than 85% throughout 2002. • Yield improvements at 130-nm effectively provide more capacity with little additional investment. • Slight increase in demand can create capacity shortages. • Foundry, DRAM, restructuring in Japan are bright spots for 2003. • Empty shells/unfinished fabs allow a fast response to new demand. • Expect manufacturers to plan and implement capacity increases very carefully.
Leading-Edge Overall Wafer Fab Utilization: Ratio of Silicon Shipment to Fab Capacity 100% 90% 80% 70% 60% 50% 4Q97 2Q98 4Q98 2Q99 4Q99 2Q00 4Q00 2Q01 4Q01 2Q02 4Q02 2Q03 4Q03 2Q04 4Q04
Leading-Edge Foundry Fab Utilization Ratio of Silicon Shipment to Fab Capacity 100% 90% 80% 70% 60% 50% 40% 4Q97 2Q98 4Q98 2Q99 4Q99 2Q00 4Q00 2Q01 4Q01 2Q02 4Q02 2Q03 4Q03 2Q04 4Q04
Foundry Market Revenue Forecast 2001-2007 CAGR 21.4% Billions of U.S. Dollars 30 25 20 15 10 5 0 2001 2002 2003 2004 2005 2006 2007
Quarterly WFE Forecast Scenarios Scenarios (Probability) Optimistic Most Likely Pessimistic 2002 -32% (0.15) -33% (0.70) -33% (0.15) 2003 +28% (0.20) +16% (0.50) +3% (0.30) Millions of U.S. Dollars (Seasonally Adjusted) 14,500 12,500 10,500 8,500 6,500 4,500 2,500 4Q98 2Q99 4Q99 2Q00 4Q00 2Q01 4Q01 2Q02 4Q02 2Q03 4Q03 2Q04 4Q04 Optimistic Pessimistic Most Likely
Percentage of Wafer Fab Equipment Shipped as 300-mm Percentage of Wafer Fab Equipment Market 90% Full Deployment 80% 70% 60% 50% Pilot/First Production 40% 30% 20% R&D 10% 0% 1997 1999 2000 2004 2006 1998 2001 2002 2003 2005 2007
2003 Growth 193-nm Steppers (~100%) 60% E-Beam Mask Lithography 50% ECD 40% 30% Steppers Implant 20% Track Market Growth Dry Etch RTP Fac. Auto CMP Process Control PVD Nontube CVD 10% Wet Clean Diffusion 0% 0 500 1,000 1,500 2,000 2,500 3,000 3,500 4,000 2003 Revenue (US$M) What Is Hot and What Is Not in 2003?Selected Wafer Fab Equipment Segments Note: Some segments include OEM sales
Total Industry P&A Factory Utilization Leading-Edge Util. Factory Utilization 100% 10 90% 8 80% 6 70% 60% 4 50% 2 40% 30% 0 1Q99 2Q99 3Q99 4Q99 1Q00 2Q00 3Q00 4Q00 1Q01 2Q01 3Q01 4Q01 1Q02 2Q02 3Q02 4Q02 1Q03 2Q03 3Q03 4Q03
Utilization for SATS SATS Utilization Leading-Edge Util. 100% 10 90% 8 80% 6 70% 60% 4 50% 2 40% 30% 0 1Q99 2Q99 3Q99 4Q99 1Q00 2Q00 3Q00 4Q00 1Q01 2Q01 3Q01 4Q01 1Q02 2Q02 3Q02 4Q02 1Q03 2Q03 3Q03 4Q03
Semiconductor Packaging and Test Market Forecast Revenue (Billions of U.S. Dollars) 50 SATS 40 IDM/OEM 30 20 10 0 1999 2000 2001 2002 2003 2004 2005 2006
Quarterly P&A Equipment Forecast Scenarios Scenarios (Probability) Optimistic Most Likely Pessimistic 2002 -21% (0.10) -23% (0.80) -25% (0.10) 2003 +40% (0.25) +25% (0.50) +14% (0.25) Millions of U.S. Dollars (Seasonally Adjusted) 2,000 1,750 1,500 1,250 1,000 750 500 250 0 4Q98 2Q99 4Q99 2Q00 4Q00 2Q01 4Q01 2Q02 4Q02 2Q03 4Q03 2Q04 4Q04 Optimistic Pessimistic Most Likely
P&A Equipment Growth in 2003 Growth Flip-Chip Bonders 40% AP Lithography Solder Ball Attach Wire Bonders Mold./Encap. Vision Inspection 30% Market Growth Lead Trim and Form Die Bonders Contact Probers Test Handlers 20% Dicing Saws 10% 0% 0 100 200 300 400 500 2003 Revenue (US$M)
Long-Term View: Cycles ContinueCapital Spending and Equipment Forecasts Capital Spending (excl. SATS) Capital Equipment [excl. Test] Billions of U.S. Dollars Billions of U.S. Dollars 70 45 40 60 35 50 30 40 25 20 30 15 20 10 10 5 0 0 1999 2001 2003 2005 2007 1999 2001 2003 2005 2007
Gartner Dataquest’s Index of Semiconductor Market Leading Indicators, December 2002: Arbitrary Units Semiconductor Revenue Growth 2.50 60% Actual Forecast 50% 2.00 40% 30% 1.50 20% 1.00 10% 0% 0.50 -10% -20% Indicator 0.00 -30% Semiconductor Growth -0.50 -40% 1981 1983 1985 1987 1989 1991 1993 1995 1997 1999 2001 2003 2005
Conclusions • Economy • Expect gradual recovery in 2003 • High uncertainty clouds immediate future • Electronic Equipment • Expect gradually improving macro conditions in 2003 to spur phased recovery pattern in application segments • Corporate spending returns in 2003, strength dependent on economy • Chips • Expect typically slow 1Q03, with demand returning in 2Q03 • Expect revenue growth of 12 percent • Capital Spending and Equipment • Supply-side fundamentals improving because of two-year spending cuts • Anticipate utilization to exceed 85% in 2H03 • More optimistic outlook on CAPEX with 15 percent growth in 2003 • Second down-leg in quarterly WFE revenue for 4Q02, 1Q03 • "Ready for Equip" fabs afford rapid equipment move in for 2003, allowing for 16% growth in WFE • Next fab build cycle slipped in 2004; next downcycle early 2006