Download
1 / 16
160 likes | 339 Views
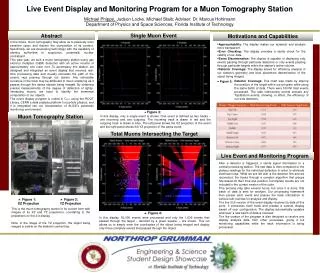
Online Monitoring and Analysis for Muon Tomography Readout System. M. Phipps , M. Staib, C. Zelenka, M. Hohlmann. Florida Institute of Technology Department of Physics and Space Sciences 150 West University Blvd Melbourne, FL 32901. Outline. Motivation Muon Tomography Station

E N D
Online Monitoring and Analysis for Muon Tomography Readout System M. Phipps, M. Staib, C. Zelenka, M. Hohlmann Florida Institute of Technology Department of Physics and Space Sciences 150 West University Blvd Melbourne, FL 32901
Outline • Motivation • Muon Tomography Station • Online Monitoring GUI • Explanation of Individual Plots • Future Plans
Motivation • Perform all monitoring and analysis in real time • Cut analysis time in half • Integrate all previous work on MTS software • Standardize the DAQ system and make it easily accessible
Scalable Readout System (SRS) Scintillator1 Scintillator2 Scintillator3 Scintillator4 GEM1 GEM2 GEM3 GEM4 GEM5 GEM6 GEM7 GEM8 DAQ Card FEC1 FEC3 FEC4 FEC5 FEC6 FEC2 DATE (Data Acquisition and Test Environment) AMORE (Automatic MOnitoRing Environment)
AMORE: Publisher and Subscribers • AMORE agent as an FSM with a single publisher and many subscribers • Each agent has its own table in MySQL database to store published data • Subscriber retrieves data by subscribing to the agent • Allows for dual processing • Secure monitoring Book Monitor Objects Start of Run Start of Cycle Monitor Cycle End of Cycle End of Run
Pedestals X-Strip Cluster X-Strip Cluster X-Strip Number X-Strip Number Y-Strip Cluster Y-Strip Cluster Y-Strip Number Y-Strip Number
Pedestals: Intuitive Explanation • Mean noise level in each channel during pedestal run is subtracted from event data A sample event on one detector in the X and Y strips following pedestal subtraction X-Strip Cluster X-Strip Number Y-Strip Cluster Y-Strip Number
Charge Clusters: Intuitive Explanation Individual Strips GEM 1 x x GEM 2 x x Track Reconstruction with Multiple Clusters GEM 3 x x GEM 4 x x
Challenges • Speed up event processing: Taking data at 30 Hz; Processing data at 10-15 Hz on 4 core processor with 10 GB RAM • Software solutions • Code optimization • Hardware solutions • Perform analysis on cluster • Parallel processing with GPUs
What's Next: Add Functionality for . . . • Event Display • Analysis Plots • 3D OpenGL Recreation of Data
Conclusions • Successfully implemented a customized GUI that makes the performance of the readout system easily accessible in real time • Revived and integrated past work into our display • Converted data analysis to online platform that is significantly faster and better suited for real-life applications