Download
1 / 23
230 likes | 258 Views
Status of Muon Tomography with SRS at FIT and some early beam results with SRS Michael Staib , Marcus Hohlmann Florida Institute of Technology Kondo Gnanvo University of Virginia RD51 Mini Week WG5 June 13, 2012. Muon Tomography for Homeland Security.

E N D
Status of Muon Tomography with SRS at FITand some early beam results with SRSMichael Staib, Marcus HohlmannFlorida Institute of TechnologyKondo GnanvoUniversity of VirginiaRD51 Mini Week WG5 June 13, 2012
Muon Tomography for Homeland Security • More than 23 million cargo containers and 93 million privately-owned vehicles were processed by U.S. Customs and Border Protection in the last year. • New requirement: 100% scanning of all U.S.-bound containers using non-intrusive imaging equipment and radiation detection equipment to search for a nuclear threat. Radiation Detectors Radiation Photo: Sci. Am., 04/2008 But it is easy to avoid passive detection of nuclear threat material that is looking for radiological signatures. Just add shielding! There may be a solution...
Muon Tomography Concept Incoming muons (from natural cosmic rays) μ μ μ μ Uranium Iron μ μ Fe U Tracking detectors Small Scattering Large Scattering Small Scattering Large Scattering Multiple Coulomb scattering to 1st order produces Gaussian distribution of scattering angles θwith width σ = Θ0: Note: Angles Exaggerated!
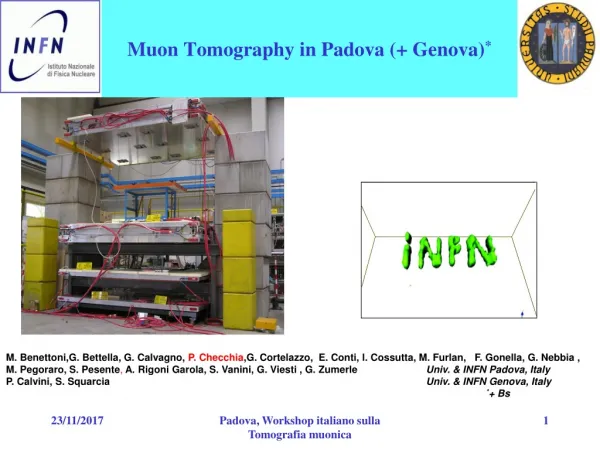
Muon Tomography with Drift Tubes CMS INFN Pb W Brass Cu Fe Al Decision Sciences Corp.: Multi-Mode Passive Detection System, MMPDSTM Reconstruction of 1 inch thick Pb letters 4.3 m 1.4 m 3 2 1 Original idea from Los Alamos (2003): Muon Tomography with Drift Tubes Decision Sciences prototype using drift tubes large enough to scan a vehicle. INFN : Muon Tomography with spare CMS Muon Barrel Chambers (Drift Tubes) J.A. Green, et al., “Optimizing the Tracking Efficiency for Cosmic Ray Muon Tomography”, LA-UR-06-8497, IEEE NSS 2006. C. Milner, et al., “Non-Invasive Imaging of Reactor Cores Using Cosmic Ray Muons”, SMU Physics Department Seminar, March 2012. S. Presente, et al., Nucl. Inst. and Meth. A 604 (2009) 738-746.
Compact Cubic-Foot Muon Tomography Station with GEMs Plastic Scintillator Triple-GEM Detector ~ 1 ft3 Two of the GEM detectors used were assembled at Florida Tech Discriminator and coincidence card
SRS for Muon Tomography • Current station configuration with 8 detectors: • 96 APV Hybrid (48 M/S pairs) • 6 ADC/FEC cards • 2 Gigabit network switches • Six 25 ns frames of data recorded for each APV per trigger yields event size of ~200kb @ 30 Hz. • DATE for data acquisition. • AMORE for data decoding, event monitoring and data analysis.
Tomographic POCA Reconstructions of Target Scenarios • Tomographic Reconstructions Presented • Material discrimination performance using five targets. • Depleted uranium shielded with medium-Z shielding. • POCA Reconstruction Limitations • Assumes multiple scattering is well approximated by a single point. • Not valid in the case of large amounts of material! Statistical methods must be employed. • Does not take into account the momentum of the muon. Object The POCA can be found using the fact that the shortest line segment joining the incoming and outgoing vectors will be orthogonal to both. Reconstruction Algorithm Point of Closest Approach (POCA)
Five-Target Scenario Five 75 cm3 targets were placed inside the imaging volume at three different Z locations. Lead Z = 82 ρ = 11.4 g/cm3 X0 = 0.56 cm Tungsten Z = 74 ρ = 19.3 g/cm3 X0 = 0.35 cm Depleted Uranium Z = 92 ρ = 19.0 g/cm3 X0 = 0.32 cm 6mm Al shielding Tin Z = 50 ρ = 7.3 g/cm3 X0 = 1.21 cm Iron Z = 26 ρ = 7.9 g/cm3 X0 = 1.76 cm
Five-Target Scenario Results are good! Can discriminate between high/low Z as well as high/medium Z. Tungsten vs. Uranium not so easy... W Pb U Results match 1/X0 dependence quite well Sn Fe Single cluster track selection 155,104 reconstructed tracks NNP cut = 5 2 mm x 2 mm x 40 mm voxels
Single cluster track selection 155,104 reconstructed tracks NNP cut = 5 2 mm x 2 mm x 40 mm voxels Five-Target Scenario XZ Slices U Sn Fe Pb W +Y +X Pb W -70 mm < Y < -30 mm -20 mm < Y < 20 mm 30 mm < Y < 70 mm YZ Slices Fe Sn Sn Pb U Fe W -70 mm < X < -30 mm -20 mm < X < 20 mm 30 mm < X < 70 mm
Stacked Five-Target Scenario • Stacks of each of the five materials were imaged using the MTS • Targets vary in size from 27 cm3 to 150 cm3 • 175,022 tracks reconstructed using single cluster selection
Stacked Five-Target Scenario 40 mm XY slice descending in Z by 5 mm per frame 40 mm slice Simple Scattering Density [deg/cm3] Single cluster track selection 175,022 reconstructed tracks NNP cut = 6 2 mm x 2 mm x 40 mm voxels We are able to discriminate between the low/medium/high-Z materials!
Single cluster track selection 175,022 reconstructed tracks NNP cut = 6 2 mm x 2 mm x 40 mm voxels Stacked Five-Target Scenario XZ Slices Pb W Fe W U U YZ Slices Fe Sn Sn Pb
Depleted Uranium with Bronze Shielding 40 mm XY slice with NNP cut increasing by 1 per frame The shielded uranium can be discriminated from the bronze shielding using POCA reconstruction Mixed track selection 187,731 reconstructed tracks 2 mm x 2 mm x 40 mm voxels
Depleted Uranium with Bronze Shielding What about the side views? XZ slice with NNP cut increasing by 1 per frame YZ slice with NNP cut increasing by 1 per frame The shielded uranium can be discriminated from the bronze shielding using POCA reconstruction Mixed track selection 187,731 reconstructed tracks 2 mm x 2 mm x 40 mm voxels
Status of Muon Tomography • We have shown the ability of the MTS using GEMs to discriminate between materials of similar volume with different Z, even as shielding. • SRS is working very well! • Still unresolved issue of network switch requirements and exact cause of missing triggers. • Will try to implement the zero suppression firmware soon and work on clock synchronization. • Plans to possibly scale to ~1 m3 active volume in the future. • Many thanks to Sorin, Hans, Filippo and Leszek for their help throughout the process.
Beam Test 2012 Zig-Zag (Chevron) strips to reduce readout channels while maintaining spatial resolution Preliminary Results CAD Design by C. Pancake, Stony Brook 2 mm 2 mm
Zero Suppression Raw Data Pedestal Subtracted Data 48 Zig-Zag RO Strips Floating channels (not connected) Zero Suppressed (5σ RMS) Data Time Evolution of Zero Suppressed Signal Strip Number
Pedestal Noise Cluster Charge Distribution Mean = 2.7 Strips Mean = 1.1 Clusters Cluster Size Distribution Cluster Multiplicity
Beam Test 2012 New RD51 tracker with resistive strip MicroMegas and SRS APV readout Readout Strips parallel to resistive strips Readout perpendicular to resistive strips
Thanks! Questions?
Post-Processing to Remove Noise • A “number of neighboring POCA ” (NNP) cut is made in order to improve the quality of the reconstructions. • There is also a cut removing all voxels with mean scattering angle less than 2 degrees. Method Results V • Add up the total number of POCA points in the blue voxels surrounding voxel V, this is the NNP. • If the NNP is less than a threshold, remove the contents of voxel V. • Repeat for all voxels in the histogram.