Download
1 / 38
380 likes | 553 Views
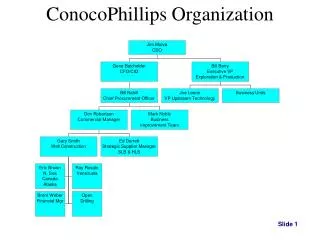
Louisiana State University. Natural Gas Conference. Gas Supply Outlook for the Gulf of Mexico. Johnny Bradberry ConocoPhillips October 27, 2003. Outline. Fundamentals/Current Situation Supply Sources Hurdles/Challenges Perspectives. ANDERSON. The Arthur Anderson partner was

E N D
Louisiana State University Natural Gas Conference Gas Supply Outlook for the Gulf of Mexico Johnny Bradberry ConocoPhillips October 27, 2003
Outline • Fundamentals/Current Situation • Supply Sources • Hurdles/Challenges • Perspectives
. ANDERSON The Arthur Anderson partner was on his phone when he said, “Ship the Enron documents to the Feds,” but his secretary heard, “Rip the Enron documents to shreds.” It turns out that it was all just a case of bad cellular. Sprint PCSThe clear alternative to cellular℠
GOM Field Discoveries Discovered 1947-1959 1960-1969 1970-1979 1980-1989 1990-2000 Source: MMS 2003
8.0 8.0 Proved Gas Reserves (TCF) Annual Gas Production (TCF) 6.0 6.0 Annual Gas Production (TCF) Annual Reserves Additions (TCF) 4.0 4.0 2.0 2.0 0.0 0.0 1945 1950 1955 1960 1965 1970 1975 1980 1985 1990 1995 2000 GOM Gas Reserves & Production Reserves Additions by Discovery Year Annual Gas Production Source: MMS
400 160 350 140 300 120 250 100 200 80 150 60 100 40 50 20 0 While Number of GOM Shelf Discoveries Has Increased, Field Size Has Dropped Number of New Fields Average Field Size # New fields Avg. field size Average Reserves Per Field (MMBOE) Number of New Field Discoveries 0 1980-2003 1950-1959 1960-1969 1970-1979 Source: MMS/PFC Energy Consultants
70 120 60 90 50 40 60 Average Reserves per Field (mmboe) 30 20 30 10 0 0 1950-1959 1960-1969 1970-1979 1980-1989 1990-1999 2000-2002 Discoveries & Reserves – GOM Deepwater Number Of Fields Discovered & Average Reserves per Field By Decade Deepwater (Water Depths At Least 1,000 Feet) Average Field Size (Right Axis) Number New Fields (Left Axis) Number of New Field Discoveries Number of New Fields Average Field Size Includes Proved & Probable Reserves Source: MMS/PFC Energy Consultants
Gulf of Mexico Gas Production Total vs. Shelf and Deepwater 6,000 5,000 4,000 BCF / Year 3,000 2,000 1,000 0 Gas Production from the Shelf is Declining While Deepwater Gas Production is Rising 5,145 5,078 5,041 5,015 5,057 4,624 4,955 4,800 4,764 4,481 4,205 3,946 3,835 3,355 1,269 1,180 999 846 560 381 278 1996 1997 1998 1999 2000 2001 2002(est.) Total Shallow Water Portion (< 1000') Deepwater Portion (> 1, 000 ft) Source: MMS/PFC Energy Consultants
U. S. and Canadian Natural Gas Supply Source: NPC 2003
Sources of Incremental Natural Gas Supply, 2000-2025 (trillion cubic feet) Alaska Gulf Slope Mountain Other Lower 48 Source: NPC 2003
GOM Areas Eastern Gulf Western Gulf Central Gulf Florida Source: MMS
GOM Shelf Status: • Very mature • 70% of current GOM supply • Rapid decline • Current reserves • Drilling pace/success • Rig availability • New discoveries small in size • Some shallow undiscovered reserves and deep shelf potential >50 TCF (MMS 2000) • Difficult drilling • Aging infrastructure • Rig availability for deep • Acreage position • Most majors have substantially decreased position • Independents dominate Prize: Challenges: Who:
Deepwater Status: • 30% of current supply • Current reserves • Projects under development • Discovery pace • Predominantly an oil play - associated gas • >135 TCF potential (MMS 2000) • Large reservoirs • Leverage existing discoveries • High cost per well/development • Technology not here yet for ultra deep • Project cycle time • Predominantly majors but independents aggressively moving in Prize: Challenges: Who:
Target Size Differences: Grand Isle 41\ 43\ 47 vs . URSA • URSA: Appx 400 MMBOE 10-50 MBOEPD/well . Single structure Up to 11 wells 15 years to recover Rec./well: • Grand Isle 41/43/47 10-40 MMBOE/ compl Appx 830 MMBOE .5-5 MBOEPD/ well 54 platforms +500 wells/+180 active - 60- 70 years to recover Recovery/well: 1.7MMBOE/well
Technological Advances - Drilling Sea bed is 1-2 miles below the rig: Requires the latest in: Marine Riser Technology BOP Control Technology Casing & Mud Program Design Dual Gradient Drilling AHC (Active Heave Compensated) Vessel Positioning
FPSO and Shuttling Subsea Processing & Metering Seabed Storage Multiphase Flow Deepwater Pipeline Expandable Casing Dual Gradient Drilling Technological Advances - Production
High Tech……High Cost What’s the most notable difference between deepwater and shallower operations? The answer is resoundingly…..Costs! • DW dev. well cost: $25MM-$40MM • Shelf, avg dev. well : $5MM-10MM • DW drilling costs: $250M-$400M/day • on shelf : $100M-$140M/day • with rig rates on shelf being only $30-40M/day compared to DW rates of $120-$220M/day
Deepwater - The Industry Responsibility Safe, Environmentally Sensitive, Cost Effective Innovation
Eastern Gulf of Mexico Status: • Currently off limits • 25 TCF potential (NPC 2003) • Can leverage existing infrastructure • Gaining access • Time to drill ready/total cycle time • Restrictions/permitting • Drilling • Mixture of majors and independents Prize: Challenges: Who:
We Can’t Wait Too Long!!! I’ve been considering living on the ground, becoming a carnivore and developing a civilization…what do you think? It’s part of my long-range escape plan. It’s part of my long-range escape plan.
Delivering Supply Won’t Be Easy Shelf Aging infrastructure /cost Geology/Drilling Mature Deepwater Technology Cycle time Cost EGOM Cycle time Gaining Access Permitting
ConocoPhillips Position Not a Dominant Position $ ? Shelf Aging infrastructure/cost Geology/Drilling Mature Deepwater Cost Cycle time Technology EGOM Gaining Access Permitting Cycle time Delivering Supply Won’t Be Easy
35 TCF Discovered >50 TCF Shallow and Deep Potential Shelf 11 TCF Discovered Deepwater >135 TCF Potential GOM/Supply EGOM 25 TCF Potential Supply Source Overview Discovered 46 TCF Potential >210 TCF Source: MMS
Shelf • Production declining rapidly. Aggressive shallow drilling essential to help offset base decline. Deep gas is critical to filling supply expectation in the near term. • Look for Independents to pick up pace – particularly deep drilling. • Majors could re-enter - deep potential and improved incentives. • Deepwater • Gas production important in filling void created by shelf decline. • Majors likely to stay primarily deepwater focused. • Once EGOM moratorium is lifted, it will take time to supply gas. Perspectives to Leave You With
New technology an important part of the supply formula. • Resource availability still a critical issue. • Need improved regulatory permitting/approval process. • Despite hurdles, outlook for GOM supply to satisfy forecasted demand is optimistic. Perspectives to Leave You With
U.S. Rig Count and Production Current Rig Count = 747 *Avg. consultants estimate for 2003 U.S. Production
US well production half-life* Months • Natural gas well production rates have been declining steadily • Rapid decline of productive capacity requires drilling more and more wells to maintain a given level of gas production * Months to reach 50% of initial production rate Source: EIA
U.S. gas production additions per rig Avg. MMCF/d added per active rig Source: Salomon Smith Barney, Aug 16, 2002 * Estimate
Drilling has failed to increase production Gas Production, Tcf/year Well Completions, ‘000/year • US gas production remained flat between 1995 and 2001 • However, it took a massive drilling effort to maintain the production flat Source: EIA
Rig Counts Slow to Respond US Gas Rig Count NYMEX Gas Price, $/MMBtu