Download
1 / 41
420 likes | 565 Views
A retrospective investigation of selectivity for Pacific halibut CAPAM Selectivity workshop 14 March, 2013 Ian Stewart & Steve Martell. Overview. 1) H istory 2) C ontributing factors 3 ) 2012 Assessment investigation 4 ) Path forward. Assessment model evolution.

E N D
A retrospective investigation of selectivity for Pacific halibut CAPAM Selectivity workshop 14 March, 2013 Ian Stewart & Steve Martell
Overview 1) History 2) Contributing factors 3) 2012 Assessment investigation 4) Path forward
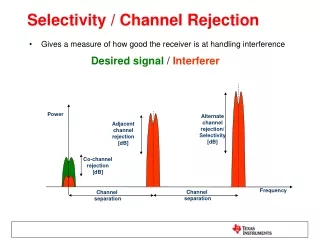
Interim: Length-based selectivity 3A Figure from: Clark and Hare, 2002
Retrospective II: Age-based selectivity 3A Figure from: Clark and Hare, 2002
Interim II: Length-based selectivity 3A Exploitable biomass (M lb) Figure from: Clark and Hare, 2004
Overview 1) History 2) Contributing factors 3) 2012 Assessment investigation 4) Path forward
Factors contributing to selectivity: • - Highly dimorphic growth • - Size-at-age: temporal trends and differences by area • - Fishery minimum size limit • - Hook-size effects – few small fish observed
Dimorphic and spatial variability Growth curves by area Length (cm) Age (years)
Historical weight-at-age (Ageing methods, sampling locations, selectivity itself, etc. may bias these trends)
Trends in size-at-age Minimum size limit
Trends in size-at-age Minimum size limit 1997 2012 (Age-11 male halibut)
Directly observed gear selectivity (vulnerability) Based on Didson acoustic camera observations (S. Kaimmer; In prep)
Selectivity by area may differ Fishery ~40% Fishery Survey Figures from: Clark and Hare, 2003 & 2004
Length-based selectivity: area (vulnerability) vs. coast-wide (vulnerability + availability) Differences in: - Biology (age, length, length-at-age) - Vulnerability Changes in proportional abundance +
Length-based selectivity: area (vulnerability) vs. coast-wide (vulnerability + availability) • Coast-wide “average” selectivity • changes over time
Spatial approaches: Separate stocks < 2006 Fishery Fishery Fishery Fishery Survey Survey Survey Survey J.D. Herder 2008 J.D. Herder 2008 J.D. Herder 2008 J.D. Herder 2008 J.D. Herder 2008 J.D. Herder 2008 J.D. Herder 2008 J.D. Herder 2008
Spatial approaches: coastwide dynamics 2006+ Fishery Survey J.D. Herder 2008 J.D. Herder 2008 Population
Overview 1) History 2) Contributing factors 3) 2012 Assessment investigation 4) Path forward
Non-parametric length-based selectivity Inputs: Minimum size bin Bin at which selectivity = 1.0 Maximum size bin Type switch SDsize SDtime (added this year) Specifications: Operates on 10cm bins Sex-specific Type: Asymptotic, ‘Ramp’, or domed above size bin = 1.0 Smoother for second difference b/w adjacent sizes within year Smoother for second difference b/w adjacent years within size bin Years for which to estimate separate curves Scaled by sex-specific catchability (so values above 1.0 are ok, since that bin is fixed) Catchability (q) can also vary among years
Non-parametric length-based selectivity Crux: There is no underlying growth model, nor distribution of lengths for a given age. The approach uses ‘true’ observed survey length-at-age to translate size- to age-based selectivity. This is done via interpolating the values at age from the values at each bin.
Retrospective within the 2011 assessment (Sequentially removing data)
Retrospective: Symptoms Age-8 Recruits (millions)
Increasing penalty on large recruitment estimates Males Total Females SSQs Increasing initial recruitment penalty
Secondary exploration: Investigate increasing the relative survey weight Explore process error in selectivity(time-varying)
Selectivity SDtime: Base-case: 0.025 (50% of smoothing over length) 0.001 0.05
Retrospective: Solution (Data only through 2011)
Retrospective: Contributing factors • Transition from area-specific to coastwide model in 2006 • (and retaining the assumption of constant availability) • Changes in the coastwide population distribution • Too much emphasis on the age data • (and not the survey trend) • 4) Short time-series
Looking forward: Comparison of spatial modeling approaches: - Coast-wide: time-varying selectivity - Implicitly spatial: fleets-as-time-periods fleets-as-areas - Explicitly spatial: Multi-area assessment Once selectivity is treated as time-varying, either length- or age-based formulations can capture the process.