Download
1 / 18
180 likes | 530 Views
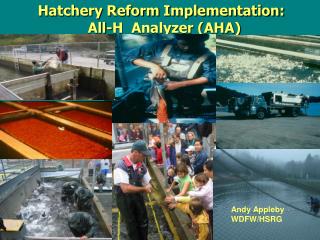
Hatchery Reform Implementation: All-H Analyzer (AHA). Andy Appleby WDFW/HSRG. Andy Appleby WDFW. Gene Flow Calculator. Currency is adult spawning fish (wild and hatchery). Allows you to calculate the amount and direction of gene flow (to and from wild/hatchery).

E N D
Hatchery Reform Implementation: All-H Analyzer (AHA) Andy Appleby WDFW/HSRG Andy Appleby WDFW
Gene Flow Calculator. Currencyis adult spawning fish (wild and hatchery). Allows you to calculate the amount and direction of gene flow (to and from wild/hatchery). What is the All-H Analyzer, really?
Important if you want the natural environment to drive the fitness of the population as a whole (hatchery and wild). Ultimately, this allows fish spawning naturally to be as productive as possible. Why is Gene Flow Important?
Fitness optima in two environments Hatchery optimum Natural optimum Trait phenotypic values
Theory Behind Guidelines for Integrated Programs (from model of Ford 2002) Hatchery selective forces Natural selective forces Hatchery Optimum Natural Optimum Natural selection pulls an integrated population in two directions. Integrated population Equilibrium point is determined by balance between hatchery-to-wild and wild-to-hatchery gene flow rates.
Two types of hatchery programs • 1. GeneticallySegregatedBroodstocks • 2. GeneticallyIntegratedBroodstocks • AHA can be used to evaluate either type.
Key Points: Integrated/Segregated • Must be able to ID hatchery- and natural-origin fish in broodstock and on spawning grounds • Program sizes must be matched to productivity and capacity of natural environment • Must be able to control numbers of hatchery fish spawning naturally • Both strategies represent trade-offs
Ecosystem perspective promotes improved performance of natural spawning fish: Developed by HSRG, WDFW, and tribal scientists as a decision support tool It integrates habitat, harvest, and hatchery information Support Tool – All H Analyzer
Does not absolutely define effects of actions Provides hypotheses for interaction of Hs and population M&E required to test hypotheses and adjust actions (fitness assumptions) Does not analyze ecological impacts of hatcheries (predation, competition) Thoughts on Using AHA
Population Parameters • pHOS = proportion of natural spawners composed of hatchery-origin adults • pNOB = proportion of hatchery broodstock composed of natural origin adults PNI = pNOB / (pNOB + pHOS) = proportional mean fitness of integrated population relative to natural population. = % time genes spend in natural environment.
Healthy habitat is key to sustaining salmon populations. Marking of fish produced from hatcheries is essential to effectively operate and monitor hatchery programs. Selective fisheries (Mark, Time/Area) may be required to maximize economic and conservation benefits. Improving hatchery programs will require additional operating and capital funds. All H-Analyzer Key Conclusions:
Uses NOAA approved Watershed/Subbasin plans (Habitat), FMEPs (Harvest), and HGMPs (Hatchery) as data sources. Identifies how all the “H”s interact to affect natural populations genetically in a transparent, scientifically defensible manner. Helps layout a series of strategies that can move us toward recovery and monitor our progress. Why Use the All-H Analyzer?
Have done analysis on hatchery programs in Puget Sound, Coast and Col. River. (Not all rivers/species have required input data) HSRG review has provided complete data sets were information is available. Where is the AHA model being used?