Download

1 / 30
300 likes | 798 Views
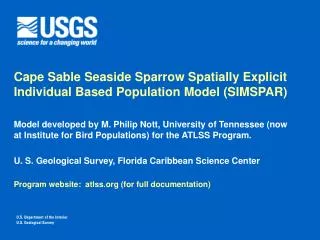
Cape Sable Seaside Sparrow Spatially Explicit Individual Based Population Model (SIMSPAR) Model developed by M. Philip Nott, University of Tennessee (now at Institute for Bird Populations) for the ATLSS Program. U. S. Geological Survey, Florida Caribbean Science Center

E N D
Cape Sable Seaside Sparrow Spatially ExplicitIndividual Based Population Model (SIMSPAR) Model developed by M. Philip Nott, University of Tennessee (now at Institute for Bird Populations) for the ATLSS Program. U. S. Geological Survey, Florida Caribbean Science Center Program website: atlss.org (for full documentation) U.S. Department of the Interior U.S. Geological Survey
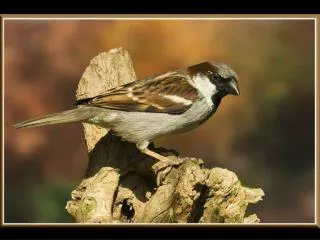
Cape Sable Seaside Sparrow • Breeds in marl prairies of Everglades • Dry season breeder, generally when water is below ground surface • Flooding late in the wet season delays reproduction • Flooding during nesting will cause nest abandonment • Dispersal is limited • There has been an approximately 90% reduction in numbers in the “western” region since 1993
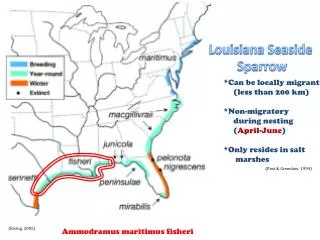
Extent of sparrow’s geographic range • Inhabits the seasonally flooded marl prairies of southern Florida currently dominated by graminoids • Preferred breeding habitat type is open prairie devoid of trees and shrubs that occurs between marsh and scrub / forest habitats • Population can be divided into three distinct sub-populations (western, core and eastern) • Sparrow breeding habitat is sensitive to hydrology (and fire)
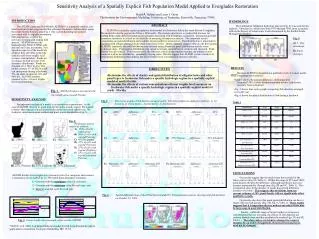
Sparrow Reproductive Behavior and Landscape Hydrology • The timing and amplitude of daily flooding events may affect the spatial extent and level of breeding success • The figure on the left shows relative elevations in the “western” Cape Sable seaside sparrow breeding area. The area is available for breeding only when it is not flooded. • The next figure shows the availability of breeding area for different years (red represents dry area for 6 months - good for breeding). x x High elevation refugia x
Identificationof habitat preferences • This shows the vegetation types in the “western” habitat area of the Cape Sable seaside sparrow. • The grid cells are 500 x 500 m. The sparrow utilizes cells for nesting territories that have a large enough fraction of Muhlenbergia grass and sparse Cladium. Areas with trees or other woody vegetation are avoided. • The SESI model, combining vegetation type with hydrology, is shown next.
Cape Sable seaside sparrow SESI model The SESI model combines the following for each spatial cell: • Cape Sable sparrow nesting habitat (vegetation type) preferences for each cell, classified by suitability value, depending on the percentage of preferred vegetation in the cell. • Dependence on water levels for each spatial cell through the reproductive season, where each cell can potentially have 0, 1, or 2 complete 45-day breeding cycles between January 1 and June 30. • Flooding events, which can cause nesting delay or failure. Hydrologic model output determines the potential breeding period for a given year and water regulation scenario for each cell.
Population Demography Model for Cape Sable Sparrow Population Dynamics • The SESI model leaves out population dynamics. This limits what it can tell us, because • the model does not project population numbers, age structure, spatial patterns, etc., through time. • the physiological, behavioral, and life cycle characteristics of the species are left out. • demographic stochasticity is not considered. • therefore, population viability analysis requires a different modeling approach.
Population Demography Model for Cape Sable Sparrow Population Dynamics • To develop the capability of simulating the population through time, a population demographic model was developed. • The Cape Sable seaside sparrow simulation model (SIMSPAR) developed by Phil Nott, is a spatially explicit individual-based model, that allows population dynamics to be projected.
ATLSS Representation of Everglades Landscape Like other ATLSS models, SIMSPAR uses: • spatially explicit topographic information • vegetation data (30 x 30 m pixels), based on FGAP • hydrologic data (daily water levels from SFWMM, refined to 500 x 500 m)
ATLSS Representation of Landscape Hydrology Why 500 x 500 meter cells? The Cape Sable seaside sparrow • responds to relatively small spatial areas of available territory, forming clusters of several pairs on areas of the order of 500 x 500 meters. • will not nest within a couple of hundred meters of trees, which is not easy to include as a rule in a grid with resolution coarser than 500 x 500 meters.
How SIMSPAR and other population demography models were developed Use of spatially explicit individual-based modeling • In these models, each individual in a population is simulated through its lifetime on a spatially explicit landscape. • The large amount of relevant empirical life cycle and behavioral data that are available can be included in such models. • An advantage is that the effects of behavior and of fine resolution environmental variability can be taken into consideration.
Constructing SIMSPAR Long-term hydrological sequences High- resolution topography High- resolution vegetation layer SIMSPAR predictions Life cycle, demographic and behavioral parameters (e.g. mortality) derived from field studies : Bass, Curnutt, Lockwood, Mayer & Pimm
Spatially Explicit Individual-Based Model for the Cape Sable Seaside Sparrow The next slides show output from SIMSPAR: • simulated conditions within the “western” Cape Sable sparrow breeding area within a given year • projected spatial distribution of nest initiations and success within a given year • projected population over a multi-year period, given historical rainfall and water regulation patterns
Fledgling Productivity Maps Projected PopulationSize
Calibration/Evaluation of SIMSPAR SIMSPAR has been calibrated and evaluated for the ‘western’ subpopulation of the Cape Sable seaside sparrow. The number of singing males counted in 1981 was used to set the initial number of sparrows in 1977. Numbers of singing males in 1992-1997, used for evaluation, were in good agreement with model projections.
Further Analyses with the SEIB Models In addition to providing output for application to evaluation, the SEIB models are being used in other ways. • Sensitivity analysis is showing the behavioral and environmental factors that the population is most sensitive to. • The models can aid in determining appropriate monitoring procedures and interpreting monitoring data.
The importance of sensitivity and uncertainty analysis The effect of uncertainties is being studied for all ATLSS models • Sensitivity analysis has been performed on the Cape Sable seaside sparrow demographic model (SIMSPAR) with respect to all important model parameters.
Sensitivity Analysis for SIMSPAR Changes in both average population size and coefficient of variance have been examined with respect to all important parameters, leading to results • Population highly sensitive to changes in overall water level • Population highly sensitive to habitat degradation • realistic loss of habitat has more severe effects than random loss • loss of whole cells has greater effect than equivalent deterioration of all cells • Cape Sable sparrow population decrease is greater than proportionate with habitat deterioration • Males could compensate to some extent for habitat loss by greater dispersal abilities • Female ability to find males with territories also a sensitive parameter in the model.
Some sensitivities examined What will the effects of sea level changes and altered water management be on vegetation and sparrow breeding success? How extensive is shrub invasion of marl prairie at higher elevations and what are the expected effects on sparrow populations?
The importance of modeling in support of monitoring Predictive modeling • “focuses data collection on non-trivial components” - Kevin Rogers (in Pickett, Ostfeld, Shackak, and Likens, 1997) • Example - sensitivity analysis of SIMSPAR • Allows us to relate what is measured to variables that we want to know • Example - virtual helicopter survey applied in SIMSPAR • Allows us to analyze and interpret monitoring data.
The importance of modeling in support of monitoring Example - Virtual helicopter survey in SIMSPAR Modeling allows us to relate what we can measure to what we want to measure, although these may be related in a complex way. • Because SIMSPAR is spatially explicit and individual-based, it is possible to simulate the sparrow counts • This is done by using a ‘virtual helicopter’, which follows the precise schedule of the real helicopter survey. • The virtual helicopter records singing males only at sites where water levels are low, there are territories, and according to a probability • Thus the model can follow the pattern of singing males, as well as the total population, thus internally calculating their ratio.
Status of SIMSPAR The spatially explicit, individual-based model of the Cape Sable seaside sparrow was developed by Nott (1998), see also Elderd and Nott (submitted). The original MatLab version of the model was delivered to ENP in 1998. A more efficient version of the model is now available.
Future Plans Work is underway to further evaluate SIMSPAR using nesting success data (data provided by Julie Lockwood). In particular, we will see how precisely SIMSPAR can predict the spatial and temporal patterns of nest initiation and success.