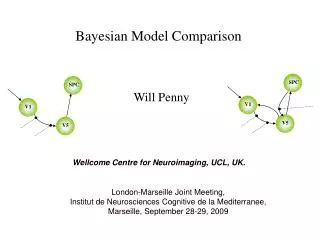
Bayesian SPARROW Model
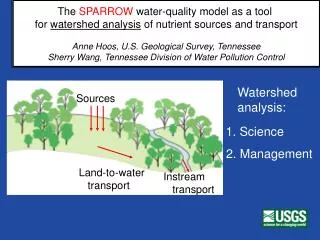
Bayesian SPARROW Model. Song Qian Ibrahim Alameddine The University of Toledo American University of Beirut. SPARROW. SPARROW : SPA tially R eferenced R egressions O n W atershed attributes SPARROW estimates the origin and fate of contaminants in river networks


Bayesian SPARROW Model
E N D
Presentation Transcript
Bayesian SPARROW Model Song Qian Ibrahim Alameddine The University of Toledo American University of Beirut
SPARROW • SPARROW: SPAtiallyReferenced Regressions On Watershed attributes • SPARROW estimates the origin and fate of contaminants in river networks • It is a semi-empirical non-linear model • It is spatial in structure andtakes into account the nested configuration of monitoring stations in a basin • Can be used to link changes in the watershed to changes in water quality
SPARROW EQUATION Nutrient loading (L) at a downstream water quality monitoring station i: Contribution fromDifferent sources (S) # of sources Losses/sinks Multiplicativeerror term # of upstream reaches
SPARROW Shortcomings Some of the shortcomings of SPARROW: • Temporal and Spatial average • Coarse spatial resolution regional specifics often omitted • Spatial autocorrelationin model residuals • Model developed to run under
What Did We Do? • We changed the model’s architecture to make it temporally dynamic • We developed a new regionalizingapproach • Substitute space (# of stations) with time (# of years) • We nestedthe model within a larger scale regional model • We assessed changes in loading over time for the Neuse subwatersheds • We moved the model to an open source platform
Neuse SPARROW: Bayesian, Dynamic, & Regional • Nested the model within the lager scale Nitrogen Southeast model (Hoos & McMahon, 2009) • Updated the model over time (time step = 2 years) • Used 12 years of data Regionalization over time • Data and model parameters change over time (dynamic) • Bayesian updating(posterior of t-1 = prior at t)
90-91 92-93 94-95 3 1 2 Neuse SPARROW: Model Fit 96-97 98-99 00-01 4 6 5
How Do We Compare to the SE Model? (Hoos & McMahon, 2009)
1990 Neuse Nitrogen Export by Basin 2001
Yield to Neuse Estuary by Basin Raleigh Raleigh Durham Durham CaryMorrisville CaryMorrisville Kinston Kinston 1990 2001
Conclusions • Regionalization of SPARROW to basin level possible:Bayesian temporally dynamic nestedmodeling framework • Loads (and model coefficients) across the basin changeover time and the model is capturing these changes • Urban runoff seems to be a concern for TN loading in the Neuse • Nitrogen loading to the Neuse Estuary have decreased relative success in environmental management