Download
1 / 21
210 likes | 232 Views
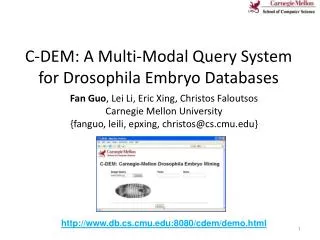
Polaris is a system that allows for the query, analysis, and visualization of large multi-dimensional databases. It extends the concept of Pivot Tables to include graphical displays and complex queries. Users can organize multiple graphs using tables, and easily change how data is viewed by dragging and dropping dimensions. Polaris provides an exploratory interface, data-dense displays, and supports multiple display types.

E N D
Polaris: A System for Query, Analysis and Visualization of Multi-dimensional Relational Databases Presented by Darren Gatesfor ICS 280
Introduction • Polaris is a system for exploring large multi-dimensional databases, using the Pivot Table interface, but extending this idea to graphical displays and allowing the construction of complex queries. • Polaris uses tables to organize multiple graphs on a display, with each table consisting of layers and panes.
Pivot Tables • Multi-dimensional databases are often treated as n-dimensional cubes. • Pivot Tables allow rotation of multi-dimensional datasets, allowing different dimensions to assume the rows and columns of the table, with the remaining dimensions being aggregated within the table.
Example: Baseball data • By dragging and dropping the dimensions to and from the left-hand column, top row, upper-left corner, and central data area (where the remaining dimensions are aggregated), one can change the Pivot Table view. Any of these views can be subsequently graphed.
Polaris Design Concepts 1 • An analysis tool for a large, multi-dimensional database must: • allow data-dense displays for a large number of records and dimensions • allow multiple display types • have an exploratory interface; should be able to rapidly change how data is viewed
Polaris Design Concepts 2 • Characteristics of tables that make them effective to display multi-dimensional data: • multivariate: multiple dimensions can be encoded in the structure of the table • comparative: tables generate “small-multiple” displays of information • familiar: users are accustomed to tabular displays
Polaris Display 1 • Drag and drop fields from database scheme onto shelves • May combine multiple data sources, each data source mapping to a separate layer • Multiple fields may be dragged onto each shelf • Data may be grouped or sorted, and aggregations may be computed
Polaris Display 2 • Selecting a single mark in a graphic displays the values for the mark • Can lasso a set of marks to brush records • Marks in the graphics use retinal properties (see subsequent slide)
Table Algebra • A formal mechanism to specify table configurations • Operators: • concatenation + • cross x • nest /
Graphics • Ordinal-Ordinal: e.g. the table • the axis variables are typically independent of each other • Ordinal-Quantitative: e.g. bar chart • the quantitative variable is often dependent on the ordinal variable • Quantitative-Quantitative: e.g. maps • view distribution of data as a function of one or both variables; discover causal relationships
Retinal Properties • Ordinal/nominal mapping vs. quantitative mapping • Properties: Shape, size, orientation, and color. • When encoding a quantitative variables, should only vary one aspect at a time
Querying • Three steps: • Select the records • Partition the records into panes • Transform the records within the panes • To create database queries, it is necessary to generate an SQL query per table pane (i.e. must iterate over entire table, executing SQL for each pane).
Discussion • Allows overlap between the relations that are divided into each pane of the Polaris display, unlike the basic Pivot Table model. • Allows more versatile computation of aggregates (e.g., medians and averages, in addition to sums). • Intuitive drag-and-drop interface, like that seen in Pivot Tables
Possible Improvements • Generate database tables from a selected set of marks • Integrate a table lens, instead of having to click a mark to view its details