Multi-Dimensional Data Visualization Techniques for Enhanced Information Design
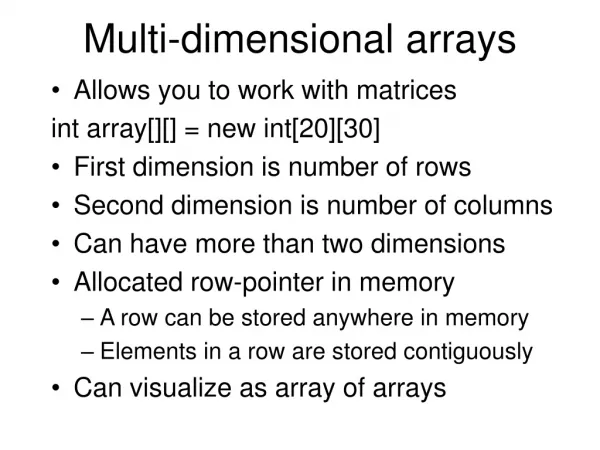
This assignment explores multi-dimensional data visualization approaches as discussed in CS5984 with foundational readings including concepts from "Externalizing Abstract Mathematical Models" and "Movable Filters." Students must gather a dataset of at least 1,000 items with a minimum of 6 attributes, visualizing it using a minimum of 2 different tools such as Spotfire or Parallel Coordinates. The report will assess usability and dynamics, informed by notable sources like "Table Lens" and "Worlds within Worlds." The focus is on data interaction and insights from complex datasets.

Multi-Dimensional Data Visualization Techniques for Enhanced Information Design
E N D
Presentation Transcript
Multi-Dimensional Data Visualization 2 cs5984: Information Visualization Chris North
Assignment • Read for Tues: • Tweedie&Spence, “Externalizing Abstract Mathematical Models” (Influence Explorer), p276 • ravi, mark • Keim, “VisDB”, p126 • ameya, sanjini • Read for Thurs: • Fishkin, “Movable filters” (Magic Lens), p253 • prasuna, umer • Doan, “Query Previews”, web page • aarthi, ameya
Homework #1: Due Thurs Feb 1 • Get some data (>=1000 items, >=6 attributes) not demo data! • Visualize it (>=2 tools) • Spotfire, Advizor/SeeIt, Table Lens, Parallel Coordinates • Written report (2-3 pages) • individual • data: • X Usability – Rex hartson • eye-tracking - Debby hix -satya, prasuna • Biotech – lenny Heath, naren R -margaret (maellis1), maulik, sumithra • NASA - Layne watson -sanjini, aarthi • dept - Cliff Shaffer -purvi • univ - Dennis kafura • software eng - Steve Edwards -umer • survey data - Jan lee -dilshad
Today • Rao, “Table Lens”, p343,597 • marty e, purvi
Today • Feiner, “Worlds within Worlds”, p96 • Me, Ajay
Nested Axes • (a,b,c,d) • (1,2,3,4) B B D C A A
Nested Axes • (a,b,c,d): d=f(a,b,c) • E.g. 2=f(1,2,0) B B D ? C A A
7d: value=f(strike,spot,time,domestic,foreign,volatility) • Max D = 6 ? > 1 nesting gets cumbersome • Not much on its value to user • Apply to 2D display? • No overview of data • Good dynamics • Great for functions, not good for data points