Download
1 / 27
270 likes | 452 Views
Increasing Aquatic Feed Production Through Plant Audits “Aquafeed Horizons”. What is the Global Seafood Market?. Estimated at more than US$ 100 billion per year (130 million ton) 30% of seafood production is from aquaculture World demand is expected to increase by up to 3% per year

E N D
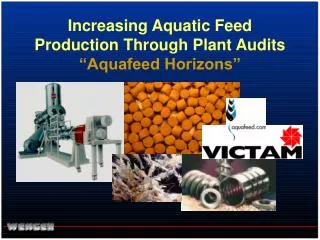
Increasing Aquatic Feed Production Through Plant Audits“Aquafeed Horizons”
What is the Global Seafood Market? • Estimated at more than US$ 100 billion per year (130 million ton) • 30% of seafood production is from aquaculture • World demand is expected to increase by up to 3% per year • Fresh water aquaculture accounts for 58% of output • Marine aquaculture accounts for 42% of output
Extruder Cut-A-Way Live bin Feeder system DDC Preconditioner Extruder barrel
Extrusion Line Audit Factors That Potentially Limit Capacity of Extruders • 1) Preconditioning capacity • 2) Available power to the extruder • 3) Volumetric capacity of extruder • 4) Open area in die • 5) Down time and Usable Product • 6) Upstream/down stream processing
50 45 40 35 30 Starch Gelatinization (%) 25 20 15 200 10 140 5 0 Retention Time 80 20 18 (sec) 16 14 20 12 10 8 6 4 2 Steam Flow Rate (% of Total) STARCH GELATINIZATION DURING PRECONDITIONING
50 45 40 35 30 20% Moisture Starch Gelatinization (%) 25 25%Moisture 20 15 10 5 0 0 20 40 60 80 100 120 140 160 180 200 220 240 260 Retention Time (seconds) Influence of Time and Moisture on Starch Gelatinization in DDC Preconditioners
Comparison of Methods for Determination of Starch Gelatinization • DSC uses a 20mg sample versus 500mg in enzyme method • DSC requires pure starch source and a raw sample for accurate sample analysis • DSC method gives inflated values compared to enzymatic method used by most cereal chemists • DSC method has poor correlation to digestibility
Extrusion Line Audit To Increase Preconditioning Capacity • Increase preconditioner size • Increase existing preconditioner fill by adjusting beater configuration • Add Retention Time Control System (RTC) • Increase energy inputs in extruder
Benefits of RTC(Retention Time Control)Preconditioning • Instant display and control of retention time to produce desired product quality • Constant rate discharge of feed upon shut down to increase usable product • Reduce waste and off-spec product during startup • Significant potential reduction in steam usage to produce equivalent product • Time/temperature documentation • Increase retention time of existing preconditioner
1500 liter DDC Preconditioner Retention Time Control Performance Specification
Extrusion Line Audit Factors That Potentially Limit Capacity of Extruders • 1)Preconditioning capacity • 2) Available power to the extruder • 3)Volumetric capacity of extruder • 4) Open area in die • 5) Down time and usable product • 6) Upstream/down stream processing
Extrusion Line Audit Increasing Power to Drive Extruder • Install larger motor (more available kW) • Check with extruder manufacturer on design limitations • Factor in effects of improved preconditioning and other process improvements
Extrusion Line Audit Factors That Potentially Limit Capacity of Extruders • 1) Preconditioning capacity • 2) Available power to the extruder • 3) Volumetric capacity of extruder • 4) Open area in die • 5) Down time and usable product • 6) Upstream/down stream processing
Increase Volumetric Capacity of Extruders • Larger extruder screw diameter • Increase extruder shaft speed • New inlet screw designs with more conveying volume • Grooved barrel liners • Control of extruder barrel temperatures
Extrusion Line Audit Factors That Potentially Limit Capacity of Extruders • 1) Preconditioning capacity • 2) Available power to the extruder • 3) Volumetric capacity of extruder • 4) Open area in die • 5) Down time and usable product • 6) Upstream/down stream processing
Increasing open area of die orifices • Use wear plate assemblies • Flare-out to larger die plates
Move to die designs that permit more die orifices on a given surface area • Insert die holder • Wear plates assembly
Extrusion Line Audit Factors That Potentially Limit Capacity of Extruders • 1) Preconditioning capacity • 2) Available power to the extruder • 3) Volumetric capacity of extruder • 4) Open area in die • 5) Down time and usable product • 6) Upstream/down stream processing
Down-Time • Plants that believe they operate 24/7 may still have 20% down time annually • Example: 10 ton/hr system down for 30 minutes is 5 ton of lost production • Increase average capacity especially with short production runs
To Reduce Down-Time • Scheduling • Hardware tools for “quick-change” • Control or software systems that compress shutdown and startup times • Operator training and experience • Preventative maintenance • New hardware design technologies • (that allow easy access for maintenance and sanitation)
Increase Usable Product (decrease off-spec material) • Automated Retention Time Control in DDC preconditioner • Screw element and liner designs to give positive conveyance • High extruder speeds and variable-speed drives • Automated control systems (SME, fat, etc.) • Warm-restart control systems compress startup time to less than 1 minute • Operator experience and training • Gentle product handling • Systems to recycle under-processed material
Extrusion Line Audit Factors That Potentially Limit Capacity of Extruders • 1) Preconditioning capacity • 2) Available power to the extruder • 3) Volumetric capacity of extruder • 4) Open area in die • 5) Down time and usable product • 6) Upstream/down stream processing
Grinding, sifting, storage, conveying, drying, cooling, coating, and packaging are all unit operations that must be sized properly to avoid a flow bottleneck!
Extrusion Line Audit Eliminating the bottlenecks can result in a50% increase in annual throughputsfor a given line! • 1) Preconditioning capacity • 2) Available power to the extruder • 3) Volumetric capacity of extruder • 4) Open area in die • 5) Down time and usable product • 6) Upstream/down stream processing “Aquafeed Horizons” WORKSHOP