Download
1 / 25
250 likes | 355 Views
Belg 2000 Seasonal Livelihoods Assessment: Summary of Results. HEA Framework: Overview. This assessment has been conducted using the Household Economy Approach (HEA) to analysing livelihoods and assessing food security.

E N D
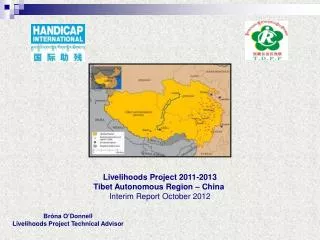
Belg 2000 Seasonal Livelihoods Assessment: Summary of Results
HEA Framework: Overview This assessment has been conducted using the Household Economy Approach (HEA) to analysing livelihoods and assessing food security. HEA starts with an understanding of how households live in a reference period….
HEA Framework: Overview …then it incorporates the impact of a shock in the current year….
HEA Framework: Overview …and finally looks at how people might be able to cope in relation to two thresholds. Livelihoods Protection Threshold Survival Threshold
Gap HEA Framework: Overview The analysis suggests that post-shock, households will not be able to maintain their normal livelihood assets without assistance. Livelihoods Protection Threshold Survival Threshold
LIVELIHOOD ZONES OF TIGRAY REGION: Baseline assessments were conducted in the region between October and March 1999 (EC) for the reference period October 1998 – September 1999 Raya Valley Sorghum and Teff Livelihood ZoneProduction: Rainfed mixed agriculture Agro-ecological zone: Kolla (lowland) Main consumption crops: sorghum, teff, maize Main cash crops: teff, sorghum, maize Main livestock: cattle, goats, sheep, chickens Market access: good Other economic activities: local agricultural work, petty trade, salt trade Hazards: erratic rainfall (once per 3 years), chronic crop pests and livestock diseases Response of poor: switching expenditure to staple food, consuming rather than selling low-value crops Woredas: Raya Azebo, Alamata, Hintalo Weijirat Alaje-Ofla Highland Livelihood ZoneProduction: Rainfed mixed agricultureAgro-ecological zone: Dega (highland) Main consumption crops: wheat, barley, pulses, maizeMajor cash crops: pulses, wheat, barleyMain livestock: cattle, sheep, chickens, goatsMarket access: medium Other economic activities: local and migrant agricultural work, petty tradeHazards: drought (once per 3 years), chronic crop pests and livestock diseasesResponse of poor: switching expenditure to staple food, consuming rather than selling low-value crops Woredas: Alaje, Ofla, Endamahoni, Hintalo Weijirat
Seasonal Assessment Steps • Seasonal assessment team members trained over 2 days • Team briefed by DPPB officials before spending over two weeks (DATES) in the field visiting (XXX) woredas in XXXX, XXXXX & XXXX zones. • Meetings held with woreda officials to discuss the food security situation and to gather crop, livestock, price and "other" information for the current meher season. Interviews also held in each woreda with traders. • Team conducted three days of analysis and report writing (DATES) using the Livelihood Impact Analysis Sheet (LIAS). • The analysis involved comparing reference year with the current year. • Beneficiaries generated by HEA analysis for each woreda (without including safety nets contribution) were compared with PSNP beneficiary numbers.
The Integrated Spreadsheet Sheet C: Crop production Sheet L: Livestock production Sheet M: Market prices Sheet O: Other sources of Food and Cash The analysis is carried out using an excel spreadsheet that stores the baseline data and accepts data on current production and market conditions
The Integrated Spreadsheet On Sheet C, crop production data is entered for the current and reference years, and the IS calculates the problem specification automatically Current year production Problem specification Reference year production Need only be entered into one column of the reference table
Weather: Belg 2000 • The onset • Quantity and quality • Duration • Implications for crops and livelihoods
Belg 2000 crops – area planted Overview by zone
Belg 2000 crops - production • Overview by zone
Meher 2000 crop prospects • Overview by zone
Livestock • WATER: • HEALTH: • FEED: • LIVESTOCK PRODUCTS: • HERD SIZES: • MIGRATION:
Market conditions • The analysis compared projected prices for the current year (now & December) with prices for the reference year in the same period. • STAPLE FOOD: • CROPS: • LIVESTOCK : • LABOUR:
Market conditions – continued • INFLATION: Overall inflation was XXX% (according to CSA data). The inflation rate for food was XXX%. The PSNP cash injection is not increasing with inflation, which means that it is losing real value significantly year by year.
Water, Education, Health • HEALTH: • WATER: • EDUCATION:
PSNP and Relief Distributions Overview by zone
Food Security Prospects - discussion • Overview by zone
Food Security Prospects - discussion continued Overview by zone
Food Security Prospects: Analysis Example REPLACE WITH AN EXAMPLE FROM THE REGION Analysis was conducted for every combination of woreda and livelihood zone. The deficits illustrated here disappear when the PSNP contribution is incorporated into the analysis.
Food Security Prospects: Analysis Example REPLACE WITH EXAMPLE FROM REGION Analysis was conducted for every combination of woreda and livelihood zone. The deficits illustrated here disappear when the PSNP contribution is incorporated into the analysis.