Download
1 / 76
760 likes | 959 Views
I. Seasonal Changes in Titan’s Cloud Activity. II. Volatile Ices on Outer Solar System Objects. Emily L. Schaller April 28, 2008. I. Seasonal Changes in Titan’s Cloud Activity. Titan. Thick atmosphere surface pressure ~1.5 bar. 27 degree obliquity 16 day rotation period.

E N D
I. Seasonal Changes in Titan’s Cloud Activity II. Volatile Ices on Outer Solar System Objects Emily L. Schaller April 28, 2008
Titan • Thick atmosphere surface pressure ~1.5 bar. • 27 degree obliquity • 16 day rotation period
Phase diagram of water T E http://www.lsbu.ac.uk/water/phase.html
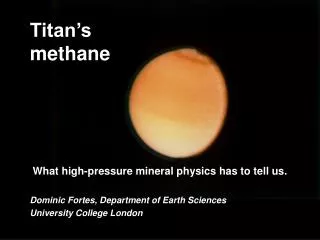
Phase diagram of methane Liquid Solid T Gas Credit: H. Roe
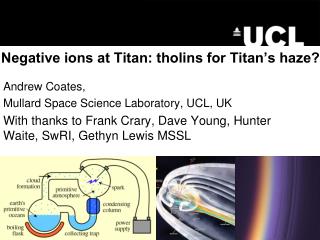
On the whiteboard in the interact room (circa December 2004)…..
Surface maps 90N 0 Latitude x 90S 180 0 West Longitude Credit: NASA/JPL/Space Science Institute
How long ago did it rain at the Huygens landing site? Or: How long ago was it cloudy?
Titan’s spectrum McKay et al., 2001
Narrowband imaging Methane transmission Adaptive optics at Keck 10-m Gemini 8-m
Titan through different filters K’ 2.12 2.17 11/13/03 11/14/03 11/11/03 11/12/03
Temperature profile (1) Stable height dry adiabat temperature surface temperature
surface temperature Temperature profile (2) cloud tops buoyancy wet adiabat condensation height convection dry adiabat temperature
Large Cloud Outbursts (Schaller et al. Icarus 2006a)
Comparison to 1995 Event (Schaller et al. Icarus 2006a)
What causes large cloud outbursts? • Surface heating? • Increased condensation nucleii? • Increased methane humidity • Injected somewhere else and brought to the pole?
Typical Titan images:November 2001- November 2004 Schaller et al. Icarus 2006b
Titan Images:December 2004 - Present Schaller et al. Icarus 2006b
Titan cloud latitudes Southern Summer Solstice South Pole ceased to be the area of maximum solar insolation South Pole ceased to be area of maximum solar insolation Titan Southern Summer Solstice Schaller et al. 2006b
Titan cloud latitudes South Pole ceased to be the area of maximum solar insolation Southern Summer Solstice South Pole ceased to be area of maximum solar insolation Titan Southern Summer Solstice Schaller et al. 2006b
Models of Titan Cloud Activity with season Present Present (intermediate case (40% rh) (moist case (80% rh) Mitchell et al. 2006 PNAS
Models of Titan Cloud Activity with season Present Rannou et al. 2006 Science
IRTF spectroscopic monitoring • Disk integrated spectra of Titan covering 0.8-2.4 microns with a resolution of 375 • Data taken every night instrument is on the telescope (172 nights 2006-2008) • Disk integrated spectra: • total fractional cloud coverage • cloud altitudes • Interrupt at Gemini to determine latitudes • These data can be compared with similar observations done in the 1990’s by Griffith et al.
IRTF Spectral Data (March-May, Oct 2006-June 2007) Spectra deviate at <2.12 microns indicating extremely low <0.15% tropospheric cloud activity in 95% of all nights
I. Conclusions: • Seasonally varying insolation and uplift from the general circulation appears to control the location of clouds on Titan. • The dissipation in Titan’s south polar clouds is the first indication of seasonal change in Titan’s weather. • Large cloud events occur in different seasons of Titan’s year and may be caused by increased methane humidity, CCN or other factors. • The near lack of cloud activity in IRTF observations (February) contrasts sharply with similar observations of Griffith et al. (2000) around autumnal equinox (Sept, Oct)
2008-April-14 2008-April-15
Asteroid Belt Spectral Types (Lewis 1995)
Classical KBOs Plutinos (3:2 resonance) Scattered Disk Objects Periodic comets Centaurs Jupiter Trojans The Outer Solar System
Pluto Brown 2000
KBOs with featureless infrared spectra 2002 TC302 2002 UX25 Relative Reflectance 2002 AW197 2003 VS2 Wavelength (microns) (Barkume et al. 2008)
Relative Reflectance Water ice model (Brown et al. 2007)
Eris Brown et al. 2005
Kuiper Belt Near Infrared Spectra Continuum? Methane-rich (e.g Pluto, Eris, 2005 FY9) Water ice rich (e.g. Orcus, 2003 EL61, 2003 AZ84) Moderate Water ice Featureless (e.g Huya, Varuna, 2003 VS2)
Rock Water Ice Volatile ices (N2, CH4, CO)
Rock Water Ice Volatile ices (N2, CH4, CO)
Volatile escape model • Assume all volatile ices are accessible to surface • Assume surface radiative equilibrium temperature • Calculate loss via thermal (Jeans) escape
Temperature (K) Diameter (km) Schaller & Brown ApJL (2007a)
` Temperature (K) Diameter (km) Schaller & Brown ApJL (2007a)
Temperature (K) Diameter (km) Schaller & Brown ApJL (2007a)