Download
1 / 17
190 likes | 368 Views
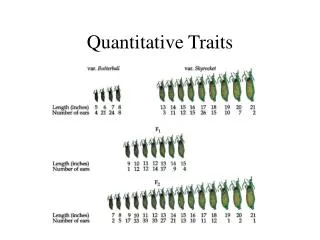
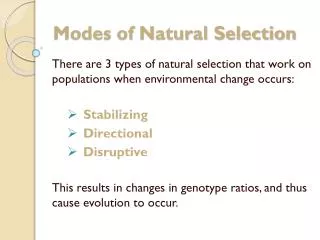
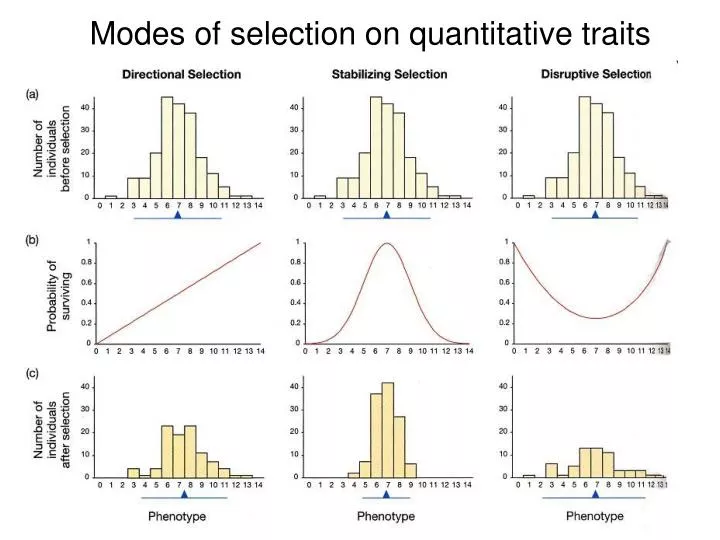
Modes of selection on quantitative traits. Directional selection. The population responds to selection when the mean value changes in one direction Here, the mean increased from 7.0 to 7.5 after one generation In directional selection, fitness increases

E N D
Directional selection The population responds to selection when the mean value changes in one direction Here, the mean increased from 7.0 to 7.5 after one generation In directional selection, fitness increases along with the value of a trait Changes the mean, and slightly lowers the variance (the standard deviation of the value)
Stabilizing selection: survival of the average Survivorship in gall-making flies Parasitism was highest for small galls Predation was highest for large galls - stabilizing selection favored average-sized galls
Stabilizing selection: survival of the average Stabilizing selection removes the extreme values of a trait Fitness is highest for individuals with intermediate values Mean value of a trait stays the same as before selection Trims the edges off the distribution, reducing the variance
Disruptive selection on bill size in seed-crackers Juveniles with either fairly large (wide + long) or fairly small beaks survived to adulthood Disruptive selection acts against birds with average-sized bills; extremes have the advantage Disruptive selection tends to split a normal (bell-shaped) distribution into two distinct, non-overlapping bells curves Does not change the mean, but increases the variance
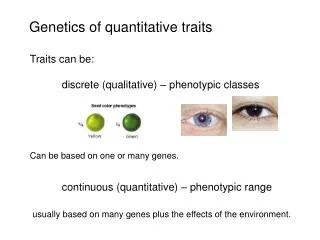
Identifying Quantitative Trait Loci (QTLs) A major goal of quantitative geneticists is to identify the genes that contribute to a given phenotype of interest We typically want to know 3 things: - How many genes contribute to a phenotype? - How much does each contribute? (i.e., large or small effect) - What are the genes, anyway? Are there 5 genes that each contribute about 20% to your height, or 1,000 genes that each contribute 0.1%?
Identifying Quantitative Trait Loci (QTLs) Standard approach: 1) find “mappable” genetic variation, meaning places on each chromosome where there is genetic variation among individuals 2) determine if genetic variation at each locus is associated with the phenotype you are interested in 3) if yes, then you have identified a Quantitative Trait Locus or QTL Note: the “variation” you map is not necessarily the same as the allelic variation that contributes to phenotypic differences, it may just be linked to the alleles that affect phenotype
Identifying Quantitative Traits: Monkeyflowers hummingbird pollinated bee pollinated Ancestral traits: large flowers little nectar bee pollinated Derived traits: red, narrow flowers much nectar bird pollinated
Identifying Quantitative Traits: Monkeyflowers hummingbird pollinated bee pollinated Research questions: How many genes are involved in flower appearance? How much does any one allele contribute to flower phenotype? are there a few genes of big influence, or lots of genes that each matter a little?
Hybrid AaBaCcDdEe Bee-polinated parent Bird-polinated parent aabbccddee AABBCCDDEE AAbbCcDdEE aaBbccddee
1-6 loci influence each of 12 floral traits For 9 of 12 traits, one locus accounted for >25% of variation in floral phenotype (genes of big effect!) bees like large, not-yellow flowers birds like purple, nectar-rich ones
Bees visit large flowers, avoid yellow pigment - allele that increased yellow pigment lowered bee visits 80% Birds like purple, nectar-rich flowers - allele that increased nectar yield doubled hummingbird visits Individual alleles can play a critical role in driving the evolution of quantitative traits so-called “alleles of large effect” may thus be key
Identifying Quantitative Traits: Human Height Advances in genomics have made it possible to determine how many genes contribute to complex human traits, and to map the approximate location of those genes Determine the # of single nucleotide polymorphisms (SNP’s) that are associated with height of the people who carry them The assumption is that a SNP associated with greater height is in linkage disequilibrium with an allele of some gene (typically not identified) that makes a contribution to how tall you are Basically: How many spots throughout the genome have genetic variation that is associated in some way with the height of the genotyped people?
Single Nucleotide Polymorphisms (SNP’s) sequence alignments can tell us if people have different nucleotides at, say, position 739,012 of chromosome 14 ATCGTGTGGAACTAATCGGCGCCGAAACTACGA ATCGTGTGGAACGAATCGGCGCCGAAACTACGA ATCGTGTGGAACGAATCGGCGCCGAAACTACGA This is a SNP – it is also a QTL if people who have a T are, on average, 1” taller than people who have a G here i.e., if this SNP is associated with height Note: This does NOT mean the “T” is causing more height… it may be in linkage disequilibrium with an allele of a nearby gene that is contributing to additive genetic variance for height
QTL’s and Human Height Adult height is a classic quantitative trait, and is highly heritable - 80% of the variation in height in a population is due to additive genetic variance However, over 40 identified QTL’s explain less than 5% of heritable variation in height Are we missing a few major genes that make large contributions to height? Or are we missing hundreds of minor players?
QTL’s and Human Height Recent study examined 183,727 individuals, comparing each person’s height to their genotype at 2.8 million SNPs Identified 180 loci influencing adult height - loci include many genes connected in cellular pathways, or that contribute to skeletal growth defects - many SNPs alter amino-acid structure of proteins or expression levels of nearby genes, meaning the SNP really is directly affecting the phenotype - some were also associated with diseases (arthritis, diabetes) suggesting pleiotropic effects of certain alleles on phenotype However, these 180 loci explain only 13% of variance in height Allen et al. 2010, Nature 467, 832–838
QTL’s and Human Height Estimated there are ~700 loci that together would explain 20% of genetic variance in height, but would need to sample 500,000 people to identify the additional loci So where is the missing variation? 3,925 people were genotyped for 294,831 SNPs, but instead of looking for SNPs associated with a certain amount of height, Yang et al. used all SNP data to model height distribution - explained 45% of height variance Thus, most heritability is not “missing” but escapes detection because most effects of individual loci are too small to pass significance tests Yang et al., Nature Genetics 42, 565–569