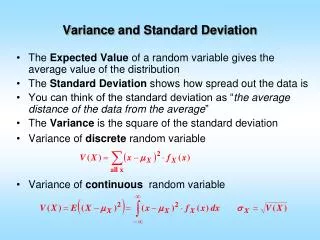
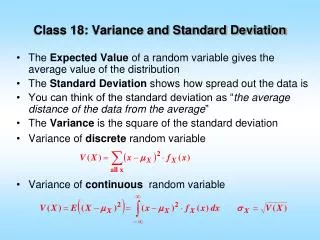
Variance and Standard Deviation
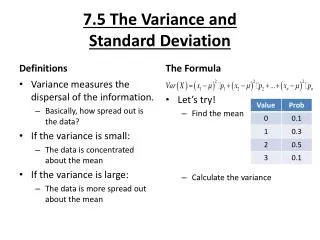
Variance and Standard Deviation. The variance of a discrete random variable is:. The standard deviation is the square root of the variance. Variance and Standard Deviation. Standard deviation. Variance. Example : Variance and Standard Deviation of the Number of Radios Sold in a Week

Variance and Standard Deviation
E N D
Presentation Transcript
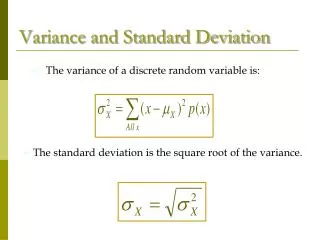
Variance and Standard Deviation • The variance of a discrete random variable is: • The standard deviation is the square root of the variance.
Variance and Standard Deviation Standard deviation Variance Example: Variance and Standard Deviation of the Number of Radios Sold in a Week x, Radiosp(x), Probability (x - X)2 p(x) 0 p(0) = 0.03 (0 – 2.1)2 (0.03) = 0.1323 1 p(1) = 0.20 (1 – 2.1)2 (0.20) = 0.2420 2 p(2) = 0.50 (2 – 2.1)2 (0.50) = 0.0050 3 p(3) = 0.20 (3 – 2.1)2 (0.20) = 0.1620 4 p(4) = 0.05 (4 – 2.1)2 (0.05) = 0.1805 5 p(5) = 0.02(5 – 2.1)2 (0.02) = 0.1682 1.00 0.8900 µx = 2.10
Expected Value and Variance (Summary) The expected value, or mean, of a random variable is a measure of its central location. The variance summarizes the variability in the values of a random variable. The standard deviation, , is defined as the positive square root of the variance.
E(x) = = xf(x) Var(x) = 2 = (x - )2f(x) Expected Value and Variance (Summary) • The expected value, or mean, of a random variable is a measure of its central location. • The variance summarizes the variability in the values of a random variable. • The standard deviation, is defined as the positive square root of the variance.
Binomial Distribution Four Properties of a Binomial Experiment • 1. The experiment consists of a sequence of n • identical trials. • 2. Two outcomes, success and failure, are possible • on each trial. 3. The probability of a success, denoted by p, does not change from trial to trial. stationarity assumption 4. The trials are independent.
Binomial Distribution Our interest is in the number of successes occurring in the n trials. We let x denote the number of successes occurring in the n trials.
Binomial Distribution • Binomial Probability Function where: f(x) = the probability of x successes in n trials n = the number of trials p = the probability of success on any one trial
Binomial Distribution • Binomial Probability Function Probability of a particular sequence of trial outcomes with x successes in n trials Number of experimental outcomes providing exactly x successes in n trials
You’re a telemarketer selling service contracts for Macy’s. You’ve sold 20 in your last 100 calls (p = .20). If you call 12 people tonight, what’s the probability of A. No sales? B. Exactly 2 sales? C. At most 2 sales? D. At least 2 sales? Thinking Challenge Example
A. P(0) = .0687 B. P(2) = .2835 C. P(at most 2) = P(0) + P(1) + P(2) = .0687 + .2062 + .2835 = .5584 D. P(at least 2) = P(2) + P(3)...+ P(12) = 1 - [P(0) + P(1)] = 1 - .0687 - .2062 = .7251 Thinking Challenge Solutions
The Department of Labor Statistics for the state of Kentucky reports that 2% of the workforce in Treble County is unemployed. A sample of 15 workers is obtained from the county. Compute the following probabilities (Hint - Binomial): three are unemployed. Note: (n = 15, p = 0.02). P(x= 3) = 0.0029 (from Binomial Table). three or more are unemployed. P(x ³ 3) = 1- [0.7386 +0.2261 + 0.0323] = 0.0031. Thinking Challenge Example
Another Example A city engineer claims that 50% of the bridges in the county needs repair. A sample of 10 bridges in the county was selected at random. What is the probability that exactly6 of the bridges need repair? This situation meets the binomial requirements. Why? VERIFY. n = 10, p = 0.5, P(x = 6) = 0.2051. Use Binomial Table
What is the probability that 7 or fewer of the bridges need repair? We need P(x £7) = P(x = 0) + P(x = 1) + ... + P(x = 7) = 0.001 + 0.0098 + ... + 0.1172 = 0.9454 OR P(x £7) = 1 – P(x=8) – P(x=9) – P(x=10) = 1 – (.0439+.0098+.0010) = 0.9454 Example Continued Use Binomial Table
Binomial Distribution • More Example: Evans Electronics Wendy is concerned about a low retention rate for employees. In recent years, management has seen a turnover of 10% of the hourly employees annually. Thus, for any hourly employee chosen at random, management estimates a probability of 0.1 that the person will not be with the company next year.
Binomial Distribution Example (Continued) Choosing 3 hourly employees at random, what is the probability that 1 of them will leave the company this year? Useing the equation. Let: p = .10, n = 3, x = 1
Tree Diagram Binomial Distribution x 1st Worker 2nd Worker 3rd Worker Prob. L (.1) .0010 3 Leaves (.1) .0090 2 S (.9) Leaves (.1) L (.1) .0090 2 Stays (.9) 1 .0810 S (.9) L (.1) 2 .0090 Leaves (.1) Stays (.9) 1 .0810 S (.9) L (.1) 1 .0810 Stays (.9) 0 .7290 S (.9)
Binomial Distribution E(x) = = np • Var(x) = 2 = np(1 -p) • Expected Value (Mean) • Variance • Standard Deviation
Evans is concerned about a low retention rate for employees. In recent years, management has seen a turnover of 10% of the hourly employees annually. Thus, for any hourly employee chosen at random, management estimates a probability of 0.1 that the person will not be with the company next year. Choosing 3 hourly employees at random, what is the probability that 1 of them will leave the company this year? What is the mean, variance and the standard deviation? Binomial Distribution: Example (Continued)
Binomial Distribution E(x) = = 3(.1) = .3 employees out of 3 Var(x) = 2 = 3(.1)(.9) = .27 • Expected Value (Mean) • Variance • Standard Deviation
Poisson & Hypergeometric Distributions Optional Readings