Download
1 / 25
260 likes | 506 Views
Central Tendency, Variance and Standard Deviation. Units of analysis, populations, samples. Units of analysis are usually people, time or places, such as countries, cities or states (provinces); the number of units is called the number of observations or ‘n’ for short

E N D
Units of analysis, populations, samples • Units of analysis are usually people, time or places, such as countries, cities or states (provinces); the number of units is called the number of observations or ‘n’ for short • Population – the whole population of the states in the U.S., the population of people in the U.S., all the countries in the world • A sample from above kinds of populations
Statistics versus parameters • Parameters indicate attributes of populations • Statistics indicate attributes of samples • When we have a sample, we use statistics to make inferences about population and therefore the parameters • Usually we do not know parameters • The study of the statistics is the study of making inferences from sample statistics to population parameters • Greek symbols are usually used for parameters and alphabetic symbols are used for statistics
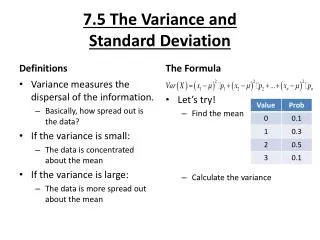
Expected Values and Probabilities • If you have a set of numbers called x: 1,1,2,2,3,3 what is the expected value? • What is P(2)? What is P(1)? What is P(3)? • If our x is: 1,1,3,3,17, then the expected value is 5, even though P(5) = 0. • Suppose we know that E(X) = 5 with the equation y = 5 + 7x. • What is E(Y)?
Variance or Dispersion • Variance is the spread about the mean • Why do we care about variance? • Variance in rights protections • Variance in election outcomes • Variance in the presence of genocide across countries • Variance in income inequality • Variance in economic growth • Variance in revolution
Measures of Dispersion • The Range • Range = Highest value - lowest value • The range of the temperature in a day around the middle of September is 40F to 85F; the range is 45 degrees • Uses only two pieces of information
The Deviation about the Mean • The Deviation about the Mean • Indicates how far a value is from the center.
Two sets of numbers and notation one number in the set place in the set mean of the set X1 = 31 X2 = 7… X = 17 X1 = 24 X2 = 27… X = 23.5
The average of the deviations • So does it make sense to calculate all of the deviations and find their average? • This would seem to give us a measure of the typical amount any given data point might vary.
The Average Deviation • Does the average of the deviations make sense?
Fixing these deviant measures • To represent variation about the mean, we have to calculate deviations as positive numbers • We must get rid of the minus signs in a mathematically acceptable manner.
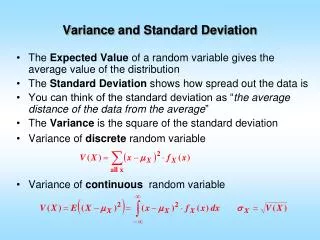
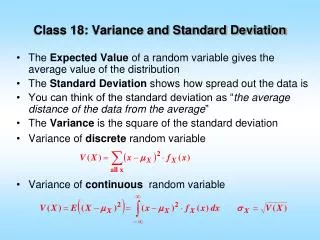
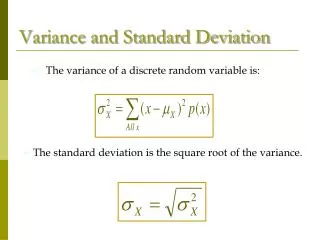
( ) n å 2 - X X i s 2 = = 1 i n Variance • Square the deviations to remove minus signs, then sum them • Read above as the sum of squared deviations from the mean • The units of variance are squares • Note that the sigma indicates population
The standard deviation • Take the square root to return to the original scale • Read above as the square root of the sum of squared deviations from the mean • Note that the sigma indicates population parameter, not a statistic
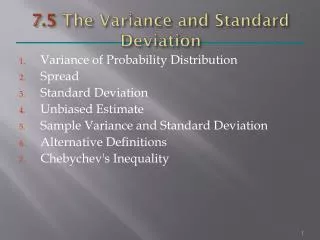
The Variance • Variance, the average of the squared deviations has some utility as well. • Variance is what we seek to explain!
Population measures • The formula for the standard deviation is not quite as I described for samples. • It turns out that the standard deviation is biased in small samples. • The estimate is a little too small in small samples. • Thus we designate whether we are using population or sample data.
Two variables: LOVAR, HIVAR Which varies more?
Stata syntax: Summarize hivar hivar ------------------------------------------------------------- Percentiles Smallest 1% -100 -100 5% -100 -100 10% -100 -100 Obs 20 25% -100 -100 Sum of Wgt. 20 50% 10 Mean 2 Largest Std. Dev. 91.85801 75% 100 100 90% 100 100 Variance 8437.895 95% 100 100 Skewness -.0667475 99% 100 100 Kurtosis 1.248016
Stata syntax:Summarize lowvar, details lovar ------------------------------------------------------------- Percentiles Smallest 1% 1 1 5% 1 1 10% 1 1 Obs 20 25% 1 1 Sum of Wgt. 20 50% 2 Mean 2 Largest Std. Dev. .9176629 75% 3 3 90% 3 3 Variance .8421053 95% 3 3 Skewness 0 99% 3 3 Kurtosis 1.25
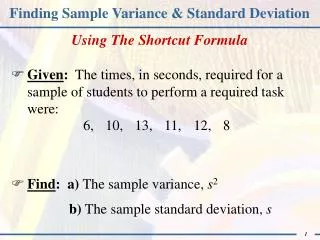
Variance of sample: LOVAR Sum of squared deviation from the mean / n-1 [(1 – 2)2 + (1 – 2)2 + (2 – 2)2 + (3 – 2)2 +(3 – 2)2 + (1 – 2)2 + (2 – 2)2 + (3 – 2)2 + (3 – 2)2 + (1 – 2)2 + (1 – 2)2 + (2 – 2)2 + (3 – 2)2 +(3 – 2)2 + (1 – 2)2 + (2 – 2)2 + (3 – 2)2 + (3 – 2)2 ] 19
Standard Deviation Square root of the sum of squared deviation from the mean / n-1 √ [(1 – 2)2 + (1 – 2)2 + (2 – 2)2 + (3 – 2)2 +(3 – 2)2 + (1 – 2)2 + (2 – 2)2 + (3 – 2)2 + (3 – 2)2 + (1 – 2)2 + (1 – 2)2 + (2 – 2)2 + (3 – 2)2 + (3 – 2)2 + (1 – 2)2 + (2 – 2)2 + (3 – 2)2 + (3 – 2)2 ] 19
Plot of HIVAR AND LOVAR . plot hivar lovar 100 + | * | | | | | | h | i | v | * a | r | | | | | | | | -100 + * +----------------------------------------------------------------+ 1 lovar 3